






Anesthesia Safety Improvement Statistics (2026): How Monitoring Changed the Numbers
Anesthesia went from a specialty regarded as a poor insurance risk in the early 1980s to one of the safest interactions in medicine, with mortality falling from roughly 1 in 10,000 anesthetics to fewer than 1 in 200,000 in healthy patients. The data below traces how that happened, what monitoring standards changed, and the honest limits of what the numbers can prove.
- Anesthesia-related mortality fell from about 64 deaths per 100,000 procedures in 1954 to roughly 1 in 10,000 by the 1980s, and to as low as 0.4 per 100,000 by the end of that decade per the APSF.
- The first minimum intraoperative monitoring standards came from Harvard in 1986, adopted by the ASA the same year.
- Use of pulse oximetry and end-tidal CO2 monitoring jumped from 6% of cases in 1985 to 70% by 1989.
- An analysis of 6,894 closed claims found death and brain-damage claims declined steadily from 1975 to 2000, but the trend was not attributable to monitoring alone, an important nuance.
- Monitoring shifted the injury pattern: respiratory damaging events fell while cardiovascular events rose to a similar share by 1992.
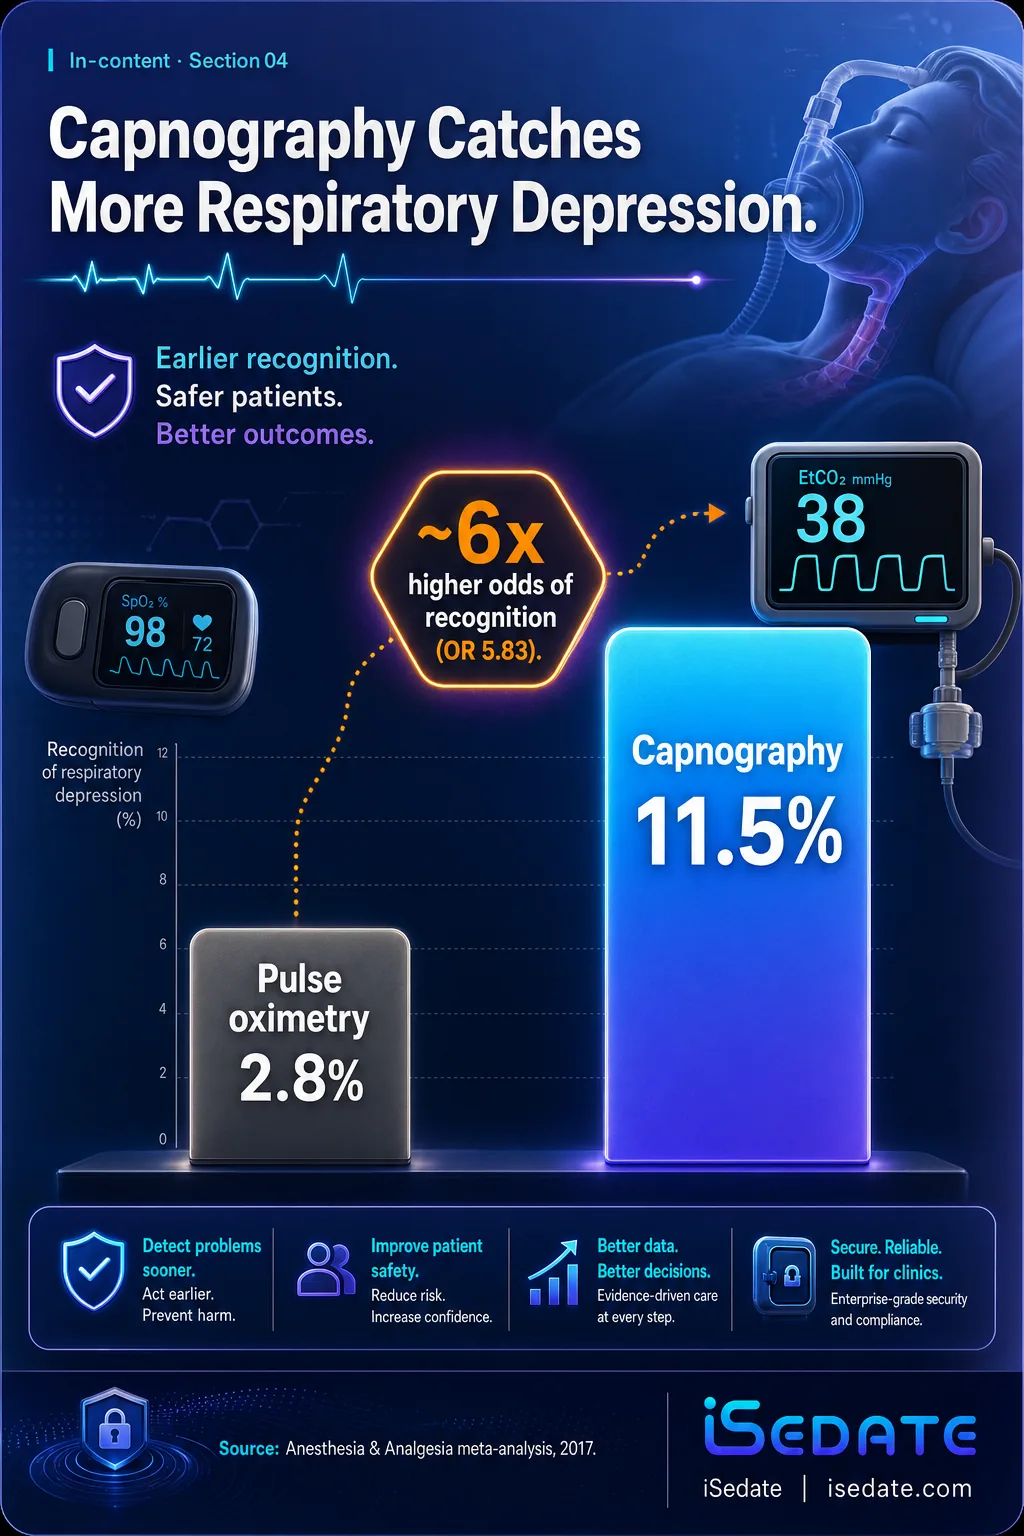
- Continuous capnography identified 8.6% more respiratory depression events than pulse oximetry, with nearly 6 times higher odds of recognizing them.
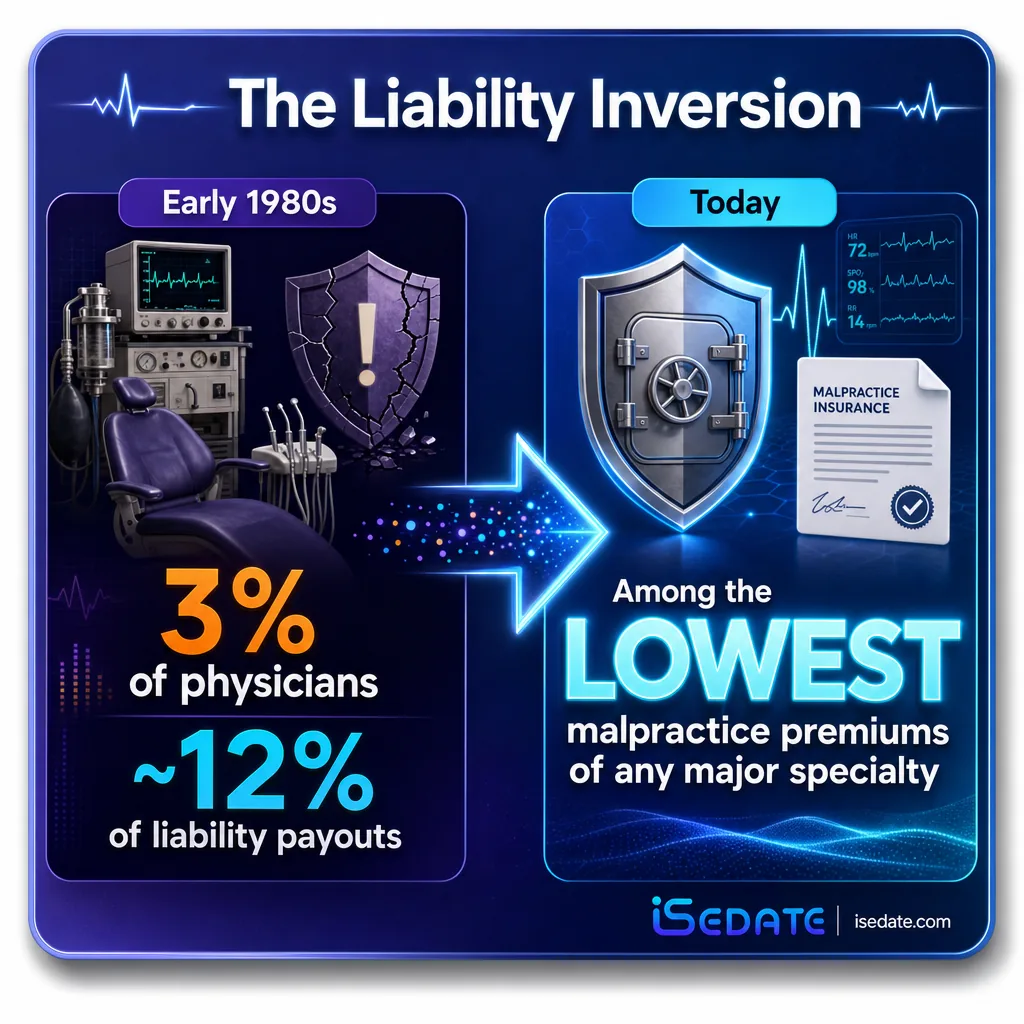
- Anesthesiologists went from about 11 to 12% of liability payouts (at 3% of physicians) to among the lowest malpractice premiums of any major specialty.
What's in This Guide
01 The Mortality Decline in Numbers
The long-run trend in anesthesia mortality is one of the clearest safety success stories in modern medicine. A 1954 report reviewing nearly 600,000 procedures estimated anesthesia-related mortality at 64 deaths per 100,000 procedures. Improved training and monitoring brought the death rate down from roughly 1 in 1,000 anesthetics in the 1940s to about 1 in 10,000 by the 1980s.
The Anesthesia Patient Safety Foundation documents the continuation of that trend: fewer than one death for every 200,000 to 300,000 anesthetics in healthy patients today. The exact figures vary by source, patient population, and how mortality is attributed, but the direction and magnitude are consistent across the literature. The improvement is real and large.
Anesthesia-Related Mortality Over Time (deaths per 100,000, approximate)
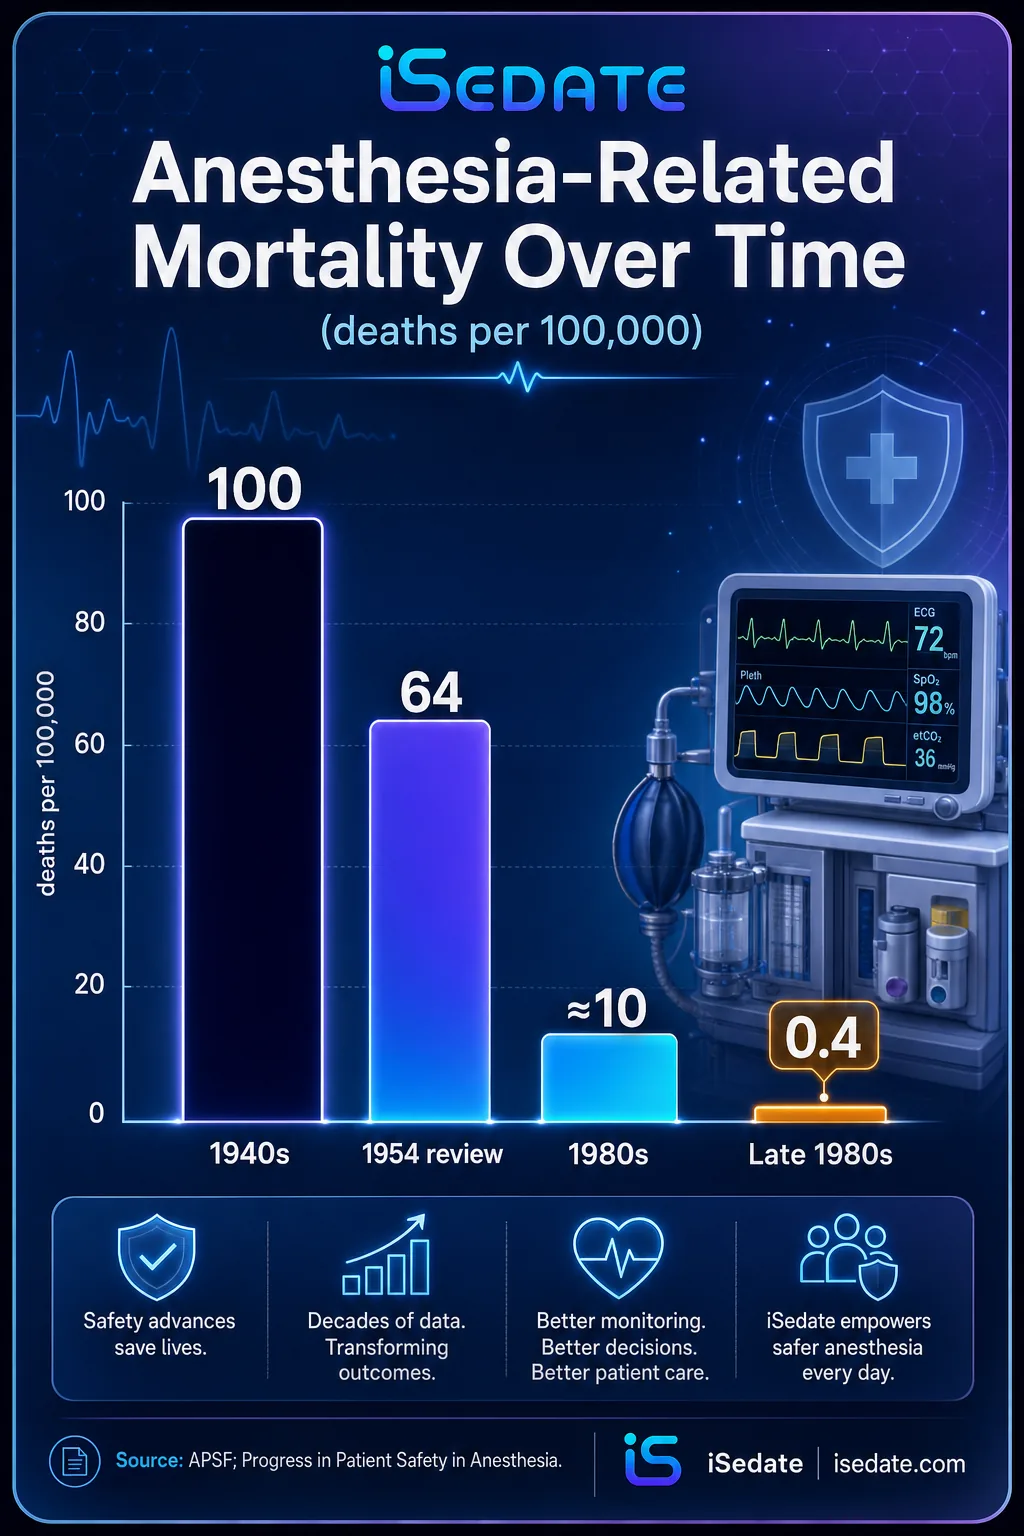
Source: Progress in Patient Safety in Anesthesia (NCBI) | Anesthesia Patient Safety Foundation history
See how SedationVault supports safer sedation
02 When Monitoring Became the Standard
The turning point was institutional as much as technological. Through the 1950s to 1970s there was a widespread impression that anesthesia itself caused mortality of 1 to 2 per 10,000 anesthetics, a level perceived as unacceptably high. National media attention in the early 1980s put a harsh spotlight on anesthesia accidents, and the profession responded by building safety infrastructure rather than reaching for tort reform.
Electronic monitoring that extended the clinician's senses, inspired oxygen measurement, capnography, and pulse oximetry, allowed genuine real-time continuous monitoring of ventilation and oxygenation for the first time. Within four years of the 1986 standards, monitoring adoption went from a small minority of cases to the clear majority. The combination of a published standard and an affordable technology drove one of the fastest practice changes in the specialty's history.
Pulse oximetry existed before 1986, but a technology only changes outcomes when it becomes expected practice. The Harvard and ASA standards converted continuous monitoring from an option into a baseline, which is what pushed adoption from 6% to 70% in four years. This is the pattern that matters for office-based sedation today: the safety benefit comes from consistent, documented monitoring on every case, not from owning the equipment.
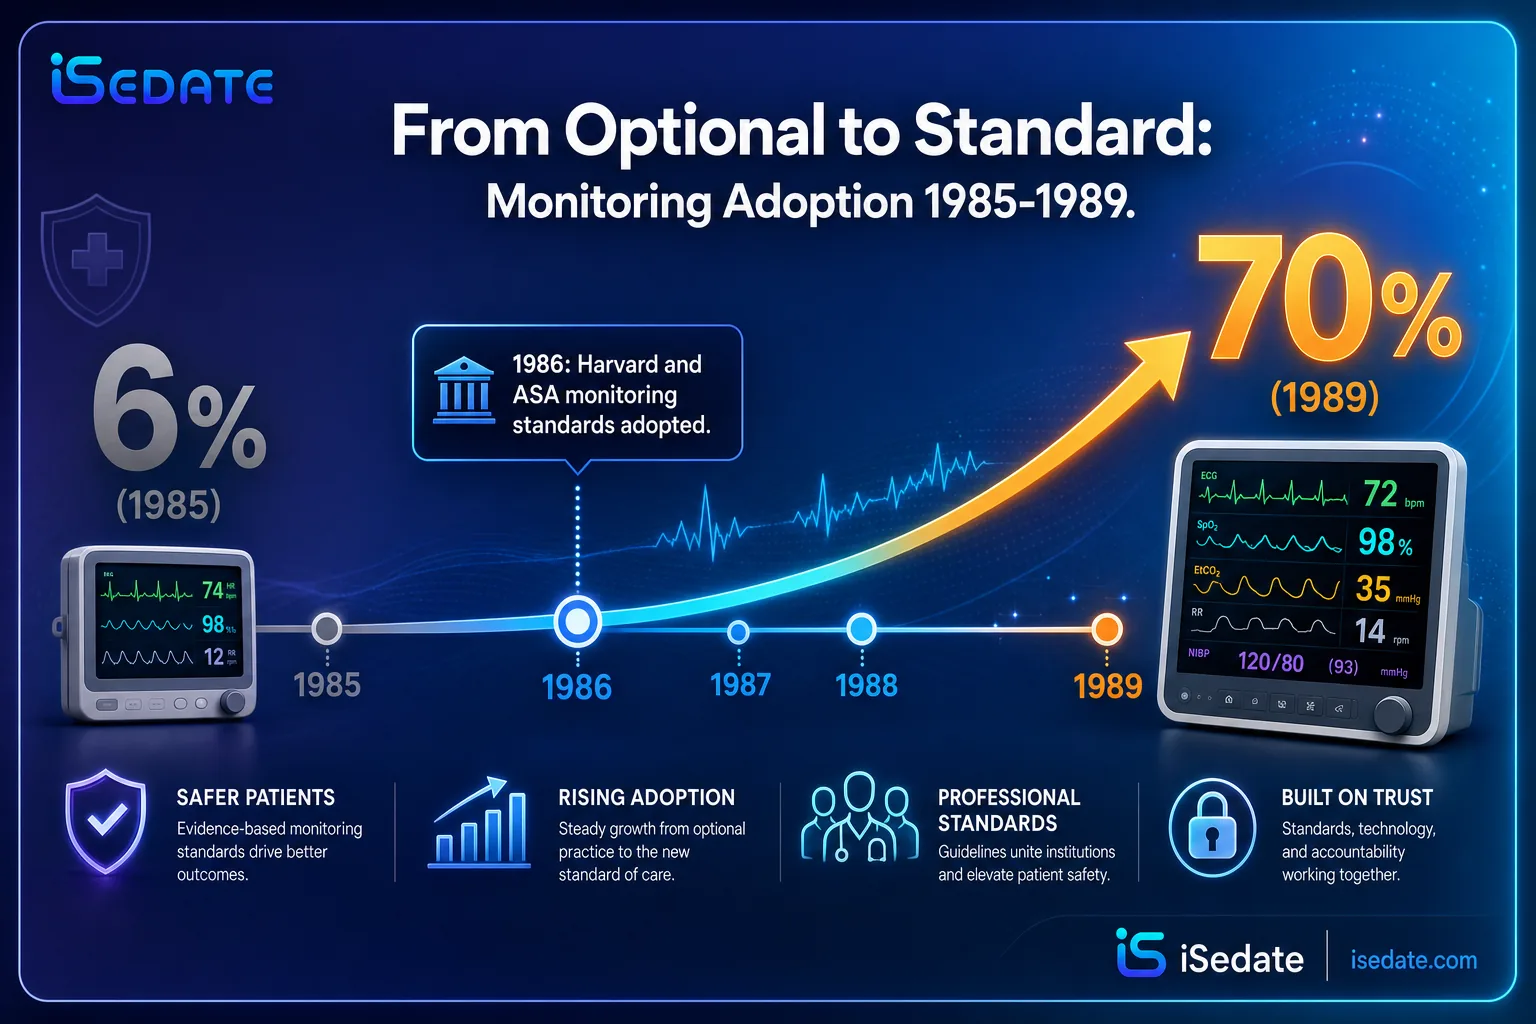
Source: Anesthesia Patient Safety Foundation history | Trends in Anesthesia-related Death and Brain Damage (PubMed)
Explore the anesthesia record software
03 What Closed Claims Actually Show
Here the data demands honesty. It is tempting to draw a straight line from monitoring standards to falling deaths, but the largest closed-claims analysis complicates that story in a way that actually strengthens the real lesson. The ASA Closed Claims Project reviewed 6,894 anesthesia malpractice claims and analyzed trends from 1975 to 2000.
Claims for death or brain damage decreased steadily across the whole period, at about 5% per year. But the analysis found that this overall downward trend did not appear to be driven by the arrival of pulse oximetry and end-tidal CO2 monitoring in 1986, because the decline was already underway before adoption climbed. What monitoring did was change the shape of the harm: respiratory damaging events decreased while cardiovascular damaging events increased, until by 1992 the two occurred in roughly equal proportion at about 28% each.
The closed-claims evidence does not support a single-cause story. Deaths and claims were already declining before monitoring became widespread, and the gains came from a bundle: monitoring, better training, published standards, the Closed Claims Project, and organizational change through the APSF. The accurate claim is narrower and stronger, monitoring measurably reduced respiratory-cause injuries, which were the events most likely to kill a patient in an office setting.
Two Tier 1 findings read together tell the real story. First, respiratory events fell as a share of death and brain-damage claims while cardiovascular events rose, reaching roughly 28% each by 1992. Second, a review of pediatric anesthesia claims found respiratory events as a primary cause of cardiac arrest fell from 51% in the 1970s to 41% in the 1980s to 23% in 1990 to 2000. The consistent signal across both datasets: monitoring's largest measurable effect was on respiratory-cause injury specifically, which is exactly the risk category that dominates office-based sedation.
Sources: ASA Closed Claims trends analysis (Cheney et al.); Mortality in Anesthesia systematic review. Calculation and interpretation original to iSedate.
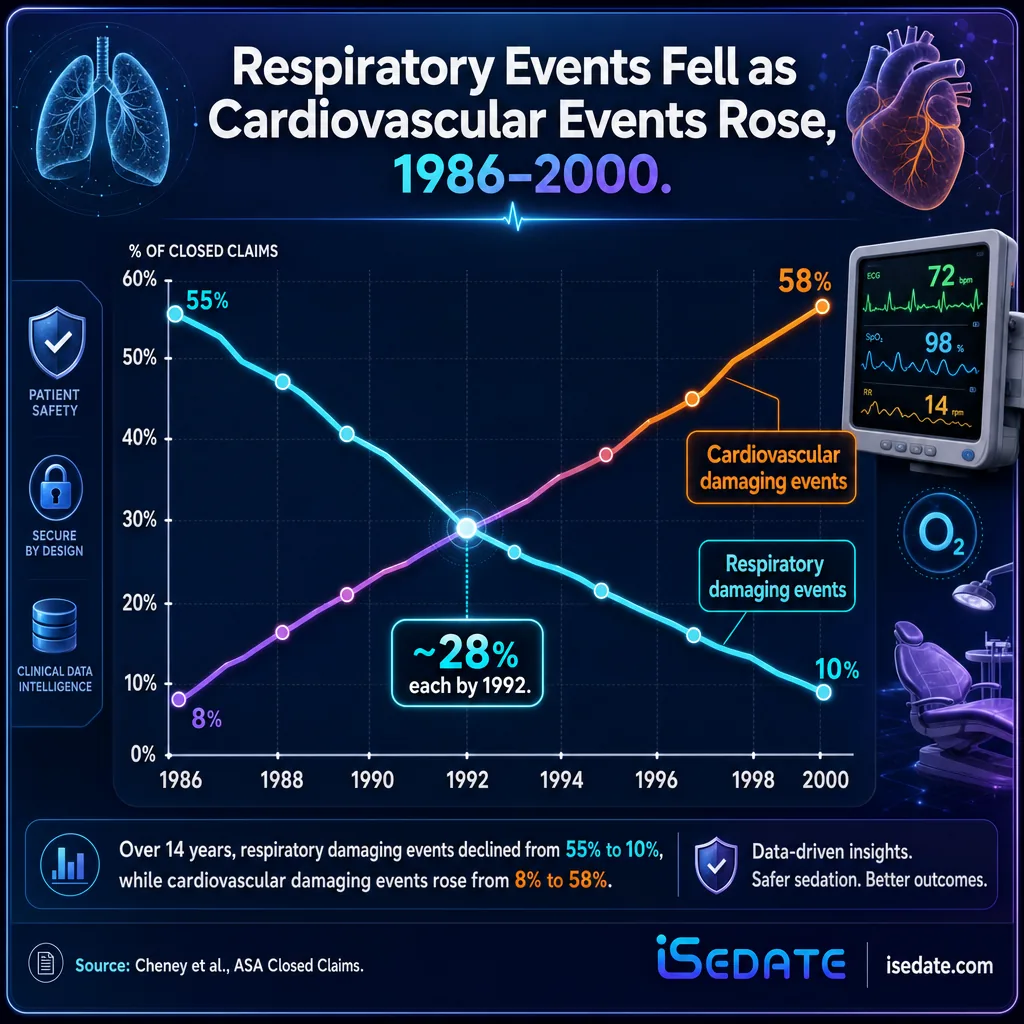
Source: Trends in Anesthesia-related Death and Brain Damage (PubMed) | Mortality in Anesthesia: A Systematic Review (NCBI)
Generate audit-ready records for every case
04 Capnography vs Pulse Oximetry
The most actionable modern data concerns which monitor catches trouble first. Pulse oximetry measures oxygen saturation; capnography measures exhaled carbon dioxide, which reflects ventilation directly. The distinction matters because ventilation problems show up in CO2 before they show up in oxygen saturation, especially when a patient is receiving supplemental oxygen that can prop up the saturation reading while breathing is already failing.
A systematic review and meta-analysis found that continuous capnography monitoring identified 8.6% more postoperative respiratory depression events than pulse oximetry alone, and the odds of recognizing respiratory depression were nearly six times higher with capnography. Separately, continuous pulse oximetry itself was far better than intermittent nursing spot-checks, with the odds of catching prolonged desaturation about 15 times higher than periodic manual checks.
| Comparison | Finding | Measure |
|---|---|---|
| Capnography vs pulse oximetry (respiratory depression detected) | 11.5% vs 2.8% | 8.6% more events caught |
| Capnography odds of recognizing respiratory depression | OR 5.83 | ~6x higher |
| Continuous pulse oximetry vs spot checks (desaturation) | OR ~12 to 15 | ~15x higher |
| Capnography and death at discharge (GI endoscopy inpatients) | OR 0.53 | ~47% reduced odds |
| Continuous pulse oximetry and ICU transfer | 34% risk reduction | trend, P = .06 |
An important caveat: some of these findings, particularly the mortality and ICU-transfer effects, come with wide confidence intervals or did not reach statistical significance in every study. The detection advantage of capnography is well established; the downstream mortality benefit is supported but less certain. For an office-based provider, the practical takeaway is that continuous, recorded monitoring catches respiratory trouble far earlier than intermittent observation, and earlier detection is what creates the window to intervene.
Source: Continuous Pulse Oximetry and Capnography Meta-analysis (PubMed) | Capnography and adverse outcomes in GI endoscopy sedation (NCBI)
See SedationVault
05 The Malpractice and Insurance Story
The safety improvement had a direct financial consequence that matters to any provider carrying malpractice coverage. In the early 1980s, anesthesiologists were regarded as especially poor malpractice insurance risks. They made up about 3% of physicians but generated a disproportionate share of liability payouts.
As monitoring standards, closed-claims research, and safety culture took hold, the risk profile inverted. Anesthesiologists moved to among the lowest malpractice premiums of any significant medical specialty. The mechanism connecting safety to premiums is documentation: closed claims are decided on the record, and a specialty that could consistently demonstrate monitored, standard-of-care management became defensible in ways it had not been before.
The same logic that lowered anesthesiologists' premiums applies to office-based sedation providers today. The malpractice-carrier question is not only whether an adverse event occurred, but whether the provider can produce a complete record showing the patient was monitored and managed to standard. That record is the difference between a defensible case and an indefensible one. iSedate's SedationVault captures live vitals from compatible monitors, including Edan, MindRay, Criticare, and more (the Edan X10 is a common example), and produces a one-click, audit-ready PDF of the full case.
Source: Closed Claims Analysis review (ScienceDirect) | Anesthesiology Closed Claims Study (The Doctors Company)
See how dentists use SedationVault
06 Summary Table: Every Statistic
| Statistic | Figure | Source | Year |
|---|---|---|---|
| Anesthesia-related mortality, 1954 review | 64 per 100,000 | Progress in Patient Safety in Anesthesia (NCBI) | 1954 data |
| Anesthetic mortality, 1940s | ~1 in 1,000 | Progress in Patient Safety in Anesthesia (NCBI) | 1940s data |
| Anesthetic mortality, 1980s | ~1 in 10,000 | Progress in Patient Safety in Anesthesia (NCBI) | 1980s data |
| Mortality by end of 1980s | 0.4 per 100,000 | APSF / Patient Safety in Anesthesiology (NCBI) | late 1980s |
| Modern mortality, healthy patients | <1 in 200,000-300,000 | Patient Safety in Anesthesiology (NCBI) | 2024 |
| Perceived mortality, 1950s-70s | 1-2 per 10,000 | Anesthesia Patient Safety Foundation | 2024 |
| Minimum intraoperative monitoring standards adopted | 1986 | APSF history | 1986 |
| Pulse oximetry / ETCO2 monitoring adoption | 6% to 70% | Cheney et al., closed claims trends | 1985-1989 |
| Closed anesthesia claims analyzed | 6,894 | ASA Closed Claims Project (Cheney et al.) | 2006 |
| Annual decline in death/brain-damage claims | OR 0.95 per year | Cheney et al. | 1975-2000 |
| Respiratory vs cardiovascular events by 1992 | ~28% each | Cheney et al. | 1992 |
| Respiratory events as cause of pediatric arrest | 51% to 41% to 23% | Mortality in Anesthesia review | 1970s-2000 |
| Capnography vs pulse oximetry (PORD detected) | 11.5% vs 2.8% | Anesthesia & Analgesia meta-analysis | 2017 |
| Odds of recognizing respiratory depression, capnography | OR 5.83 | Anesthesia & Analgesia meta-analysis | 2017 |
| Odds of recognizing desaturation, continuous vs spot | ~15x higher | Anesthesia & Analgesia meta-analysis | 2017 |
| Continuous pulse oximetry and ICU transfer | 34% risk reduction | Anesthesia & Analgesia meta-analysis | 2017 |
| Capnography and death at discharge (GI inpatients) | OR 0.53 (~47%) | Capnography GI endoscopy study (NCBI) | 2017 |
| Anesthesiologists' share of physicians vs payouts | 3% vs ~12% | Closed Claims Analysis review (ScienceDirect) | 2011 |
| Claim frequency decrease | 1-2% | Anesthesiology Closed Claims Study | 2014-2015 |
07 Frequently Asked Questions
How much has anesthesia mortality dropped over time?
When did continuous monitoring become the anesthesia standard?
Did monitoring alone cause the drop in anesthesia deaths?
How did anesthesia safety affect malpractice insurance?
Does capnography detect problems earlier than pulse oximetry?
All figures trace to primary or peer-reviewed sources. Historical mortality estimates vary by source and attribution method and are reported as published. Sources include:
- Cheney FW et al. "Trends in Anesthesia-related Death and Brain Damage: A Closed Claims Analysis." Anesthesiology (ASA Closed Claims Project, 6,894 claims)
- "Progress in Patient Safety in Anesthesia" (NCBI/PMC)
- "Patient Safety in Anesthesiology: Progress, Challenges, and Prospects" (NCBI/PMC)
- "Mortality in Anesthesia: A Systematic Review" (NCBI/PMC)
- Anesthesia Patient Safety Foundation, APSF History
- "Continuous Pulse Oximetry and Capnography Monitoring for Postoperative Respiratory Depression: A Systematic Review and Meta-analysis." Anesthesia & Analgesia (2017)
- Capnography and adverse outcomes during GI endoscopic procedures with sedation (NCBI/PMC)
- "Closed Claims Analysis" review, Best Practice & Research Clinical Anaesthesiology (ScienceDirect)
- The Doctors Company, "Anesthesiology Closed Claims Study"
The anesthesia safety story is ultimately about consistent monitoring and a record that proves it. iSedate's SedationVault brings that same discipline to office-based sedation: live vitals capture, a chart that builds itself, and audit-ready documentation for every case. To see how it works in your practice, book a demo.