






Dental Insurance Claim Denial Statistics (2026): Rates, Reasons, and Appeals
Insurers on HealthCare.gov denied 19 percent of in-network claims in 2024, and fewer than 1 percent of those denials were ever appealed, according to federal transparency data analyzed by KFF. For dental and sedation practices, denials are a revenue and documentation problem, and the numbers show where the pressure points are.
Key Takeaways
- 19 percent of in-network claims were denied by HealthCare.gov insurers in 2024, with a combined 20 percent across in- and out-of-network claims (CMS/KFF).
- Denial rates ranged from 3 percent to 36 percent across insurers, a twelvefold spread depending on carrier and state (CMS/KFF).
- Administrative and "Other" reasons dominate: 36 percent "Other" plus 25 percent administrative, versus just 5 percent for medical necessity (CMS/KFF).
- Under 1 percent of denials are appealed, and 66 percent of the appeals filed are upheld by the insurer (CMS/KFF).
- No uniform national dental denial rate exists in public data. Federal transparency data exclude stand-alone dental plans.
- NAIC's national summary put the average claims denial rate at 16 percent for 2024 across many insurers (NAIC MCAS).
- Documentation is the lever: missing subscriber data, radiographs, and frequency conflicts drive the largest share of preventable dental denials (ADA).
What's in This Guide
1 Claim Denial Rates: The Baseline Numbers
The most reliable public window into insurance claim denials comes from federal transparency data that the Affordable Care Act requires insurers to report. KFF's analysis of the CMS Transparency in Coverage data gives the clearest baseline available.
Insurers reported receiving about 496 million claims in 2024. Of the 451 million in-network claims, roughly 85 million were denied, an average in-network denial rate of 19 percent. That figure has held remarkably steady across recent years.
Averages hide enormous variation. Insurer denial rates for in-network claims ranged from 3 percent to 36 percent, and 26 of 157 reporting insurers denied 25 percent or more of claims. Geography matters too: Hawaii posted the highest average state denial rate at 27 percent, while South Dakota was lowest at 7 percent.
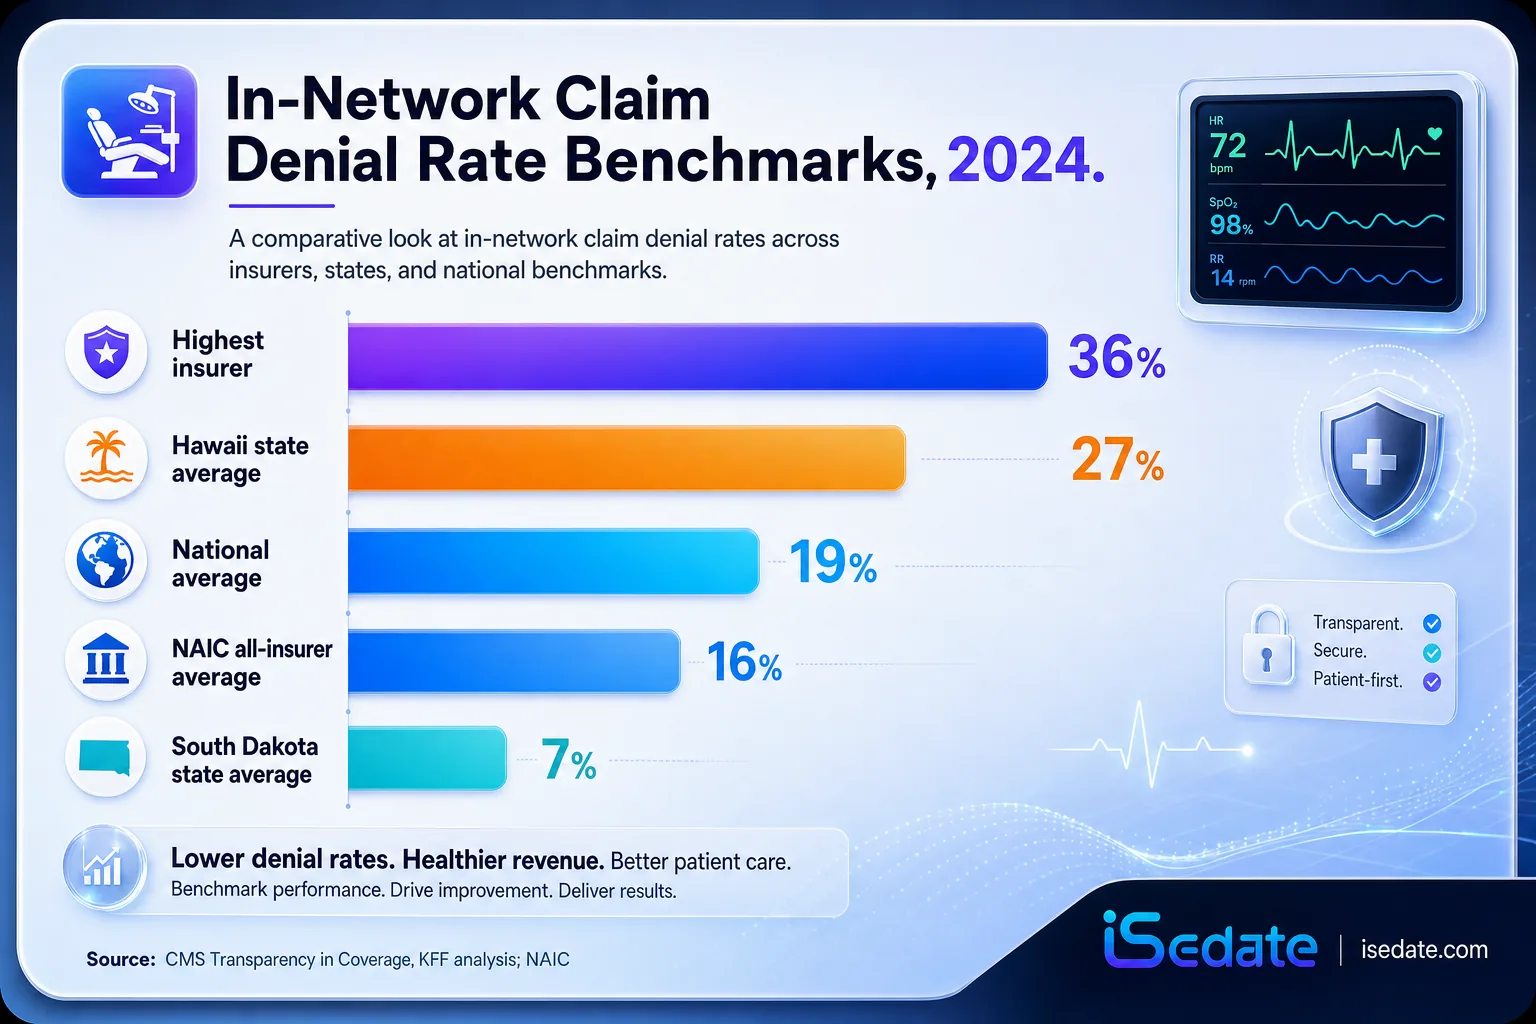
In-Network Claim Denial Rate, Selected Benchmarks, 2024
A separate national benchmark comes from the National Association of Insurance Commissioners. Its Market Conduct Annual Statement summary put the average claims denial rate for combined in- and out-of-network claims, excluding pharmacy, at 16 percent in 2024.
Source: KFF analysis of CMS Transparency in Coverage data | National Association of Insurance Commissioners
See how audit-ready records support clean claim submission
2 The Dental Data Gap
Here is a fact that surprises most practice owners: there is no authoritative, uniform national dental insurance claim denial rate in public data. The gap is worth understanding before trusting any single number.
Myth: "The national dental claim denial rate is X percent"
The federal CMS transparency dataset that produces the reliable 19 percent figure explicitly excludes stand-alone dental plans. That means the most-cited denial statistic does not measure dental at all. Dental-specific denial rates commonly quoted online, often in the 10 to 15 percent range, generally trace back to billing vendors and revenue-cycle companies rather than a primary government or actuarial source. They may be directionally useful, but they are estimates, not audited public figures. Treat any single dental denial percentage with appropriate caution.
What does exist for dental is process data. The ADA Council on Dental Benefit Programs has long documented adjudication friction unique to dentistry: no uniform carrier standard for when radiographs must accompany a claim, frequent requests for attachments after submission, and lost claims or lost X-rays that force resubmission. These process gaps generate denials and delays that never show up in a clean national statistic.
A handful of states publish partial data. California requires Covered California insurers to report claims data similar to HealthCare.gov, where insurers denied an average of 21 percent of in-network claims in 2023. Connecticut's largest insurers reported an overall 14 percent denial rate in 2024, and Vermont insurers denied an average of 8.5 percent of total claims. None of these isolate dental cleanly, but they confirm that denial rates vary widely by market and reporting method.
Source: KFF analysis of CMS Transparency in Coverage data | ADA Council on Dental Benefit Programs
Generate audit-ready PDF reports for claim documentation
3 Why Claims Get Denied
The federal data break denials into reason categories, and the pattern is revealing. Most denials are not about clinical judgment. They are about paperwork.
Among in-network denials with a reported reason, "Other" led at 36 percent, followed by administrative reasons at 25 percent. Administrative denials include duplicated claims, missing information, untimely filing, and unapproved providers. Only 13 percent were for an excluded service, 9 percent for lack of prior authorization or referral, and just 5 percent were based on medical necessity.
Reported Reasons for In-Network Claim Denials, 2024 (CMS/KFF)
In dental billing specifically, the same administrative pattern holds. Practice management and billing sources consistently cite five recurring dental denial drivers: missing or invalid subscriber information, procedures not covered under the plan, frequency limits exceeded, missing pre-authorization, and missing radiographs or documentation. The common thread is that the claim was clinically valid but administratively incomplete.
iSedate Analysis: Preventable denial share
Combining the CMS reason categories, administrative denials (25 percent) plus the largest slice of "Other" (36 percent, which CMS notes is dominated by unspecified and often administrative causes) means the majority of denials stem from process and paperwork rather than a coverage or clinical dispute. Even taking only the clearly administrative 25 percent as a floor, roughly one in four denials is a documentation problem before adding coding, eligibility, and attachment errors.
Formula: Administrative reason share (25%, CMS/KFF) established as a conservative floor for process-driven denials, with the 36% "Other" category adding an upper bound where CMS attributes much of it to unspecified administrative causes.
Calculation and interpretation original to iSedate.
Source: KFF analysis of CMS Transparency in Coverage data | ADA Council on Dental Benefit Programs
Explore SedationVault, the Sedation Intelligence System
4 Appeals: Rarely Filed, Often Winnable
The most striking numbers in the denial data are not about denials at all. They are about what happens next, or rather, what usually does not happen.
Of roughly 85 million denied in-network claims in 2024, consumers appealed only about 262,982, an appeal rate under 1 percent. When they did appeal, insurers upheld the original denial 66 percent of the time. The flip side is meaningful: about a third of appealed denials were overturned in the patient's favor.
Awareness is a large part of the problem. A KFF consumer survey found that only 40 percent of consumers believed they had a legal right to an external appeal, while 51 percent were unsure. Marketplace enrollees were the least likely to know their appeal rights, at 34 percent, compared with 58 percent of Medicare beneficiaries.
The appeal gap is a revenue gap
When roughly a third of appealed denials are reversed but fewer than 1 percent are appealed, most reversible denials are simply written off. For a dental practice, a denied claim that is never resubmitted or appealed is revenue left on the table. Practices that treat appeals as a standard part of the revenue cycle, not an exception, recover payments that peers abandon.
External review, the independent appeal available after an internal appeal is upheld, is used even less. Marketplace enrollees filed at least 5,881 external appeals in 2024, a small fraction of upheld internal appeals. Yet outside research on external review consistently finds that a large share of those decisions overturn the original denial.
Source: KFF analysis of CMS Transparency in Coverage data
How office managers manage documentation and reporting
5 What Denials Cost a Practice
Denials are not just a payer statistic. They translate directly into administrative labor, delayed cash flow, and abandoned revenue at the practice level.
Public frustration is real and measurable. A January 2026 KFF poll found that two-thirds of insured adults consider delays and denials a major problem, and one-third reported having a claim denied for a doctor-prescribed service in the prior two years. An earlier poll found 55 percent wanted closer regulation of insurer approval and denial decisions.
For practices, each denied claim triggers rework: verifying eligibility again, gathering documentation, resubmitting, and following up. Government prior-authorization data show the scale of the review apparatus practices navigate. Medicare Advantage plans issued 4.1 million prior-authorization denials in 2024, an 8 percent denial rate, and a federal report found Medicaid managed care organizations denied more than 2 million prior-authorization requests in 2019, a rate near 13 percent.
The through-line across every dataset is that denials are largely preventable and frequently reversible. The two levers a practice controls are clean, complete documentation at submission and a disciplined appeal process afterward. Neither requires changing what payers do, only how thoroughly the practice supports each claim with defensible clinical records.
Source: KFF analysis of CMS Transparency in Coverage data | KFF Medicare Advantage prior authorization analysis
Summary Table: All the Numbers
| Statistic | Figure | Source | Year |
|---|---|---|---|
| In-network claim denial rate | 19% | CMS/KFF | 2024 |
| Combined in- and out-of-network denial rate | 20% | CMS/KFF | 2024 |
| Out-of-network denial rate | 37% | CMS/KFF | 2024 |
| Denial rate range across insurers | 3% to 36% | CMS/KFF | 2024 |
| Highest state average (Hawaii) | 27% | CMS/KFF | 2024 |
| Lowest state average (South Dakota) | 7% | CMS/KFF | 2024 |
| NAIC national average denial rate | 16% | NAIC MCAS | 2024 |
| Covered California in-network denial rate | 21% | Covered CA/KFF | 2023 |
| Connecticut largest insurers denial rate | 14% | CT/KFF | 2024 |
| Vermont total claims denial rate | 8.5% | VT/KFF | 2024 |
| Denials coded "Other" | 36% | CMS/KFF | 2024 |
| Administrative-reason denials | 25% | CMS/KFF | 2024 |
| Excluded-service denials | 13% | CMS/KFF | 2024 |
| No prior auth/referral denials | 9% | CMS/KFF | 2024 |
| Medical-necessity denials | 5% | CMS/KFF | 2024 |
| Denied claims that were appealed | <1% | CMS/KFF | 2024 |
| Appeals upheld by insurer | 66% | CMS/KFF | 2024 |
| Consumers aware of external appeal right | 40% | KFF survey | 2023 |
| Insured adults calling denials a major problem | 66% | KFF poll | 2026 |
| Medicare Advantage prior-auth denial rate | ~8% | KFF | 2024 |
| Medicaid MCO prior-auth denials | 2 million+ | HHS OIG | 2019 |
Frequently Asked Questions
What percentage of insurance claims are denied?
Is there a national dental insurance claim denial rate?
What is the most common reason claims get denied?
How often do people appeal denied claims?
How can dental practices reduce claim denials?
Methodology and Sources
Claim denial rates, denial reasons, and appeal figures are drawn from KFF's analysis of the Centers for Medicare and Medicaid Services (CMS) Transparency in Coverage Public Use File, published September 26, 2025, covering qualified health plans offered on HealthCare.gov in 2024. Additional denial benchmarks come from the National Association of Insurance Commissioners (NAIC) Market Conduct Annual Statement summary and from state reporting in California, Connecticut, and Vermont as compiled by KFF. Prior-authorization figures are from KFF analyses of federal Medicare Advantage data and a 2023 HHS Office of Inspector General report on Medicaid managed care. Dental-specific adjudication and documentation context is from the American Dental Association Council on Dental Benefit Programs. Public-opinion figures are from KFF Health Tracking Polls.
An important limitation applies to all dental claim denial figures: the primary federal transparency dataset excludes stand-alone dental plans, and no uniform public source reports a single national dental denial rate. Dental-specific percentages circulating in industry media generally originate from billing and revenue-cycle vendors rather than a primary government or actuarial source and are identified as estimates where referenced.
Media and press: Journalists and researchers are welcome to cite these statistics with attribution to iSedate and a link to this page. Each figure includes its original Tier 1 source for independent verification.