






Dental Insurance Fraud Statistics (2026): Losses, Types, and Enforcement
Dental fraud and abuse costs an estimated 5.2 billion to 17.4 billion dollars a year, yet the sector draws far less investigative scrutiny than the rest of health care, according to NADP and NHCAA data. For the ethical majority of dentists, the practical risk is not committing fraud but being flagged by an outlier-detection system and having to prove clean claims.
Key Takeaways
- $5.2B to $17.4B a year in estimated dental fraud and abuse, from applying NHCAA's 3 to 10 percent rate to $174B in 2023 dental spend (NADP/NHCAA/ADA HPI).
- Upcoding and billing for services not rendered are the most common scheme types across health care (NHCAA, OIG).
- Under-investigated: about 188,074 licensed dentists in 2022 versus roughly 330 open OIG investigations (NADP/ACFE/OIG).
- Fraud vs waste: fraud is intentional; waste is error from poor coding knowledge, but dentists are liable either way (NADP).
- Enforcement is scaling: the 2024 federal takedown charged 193 defendants over $2.75B, part of $27B+ charged since 2007 (DOJ).
- Detection is data-driven: plans flag outlier billing patterns, then audit records and charts (NADP).
- Prevention beats clawback: stopping bad payments up front reduces administrative burden for everyone (NADP).
What's in This Guide
1 The Scope of Dental Fraud
Fraud in dentistry is real but hard to size precisely, because most estimates are derived from broader health care rates applied to dental spending. The resulting range is wide, and the honest framing matters.
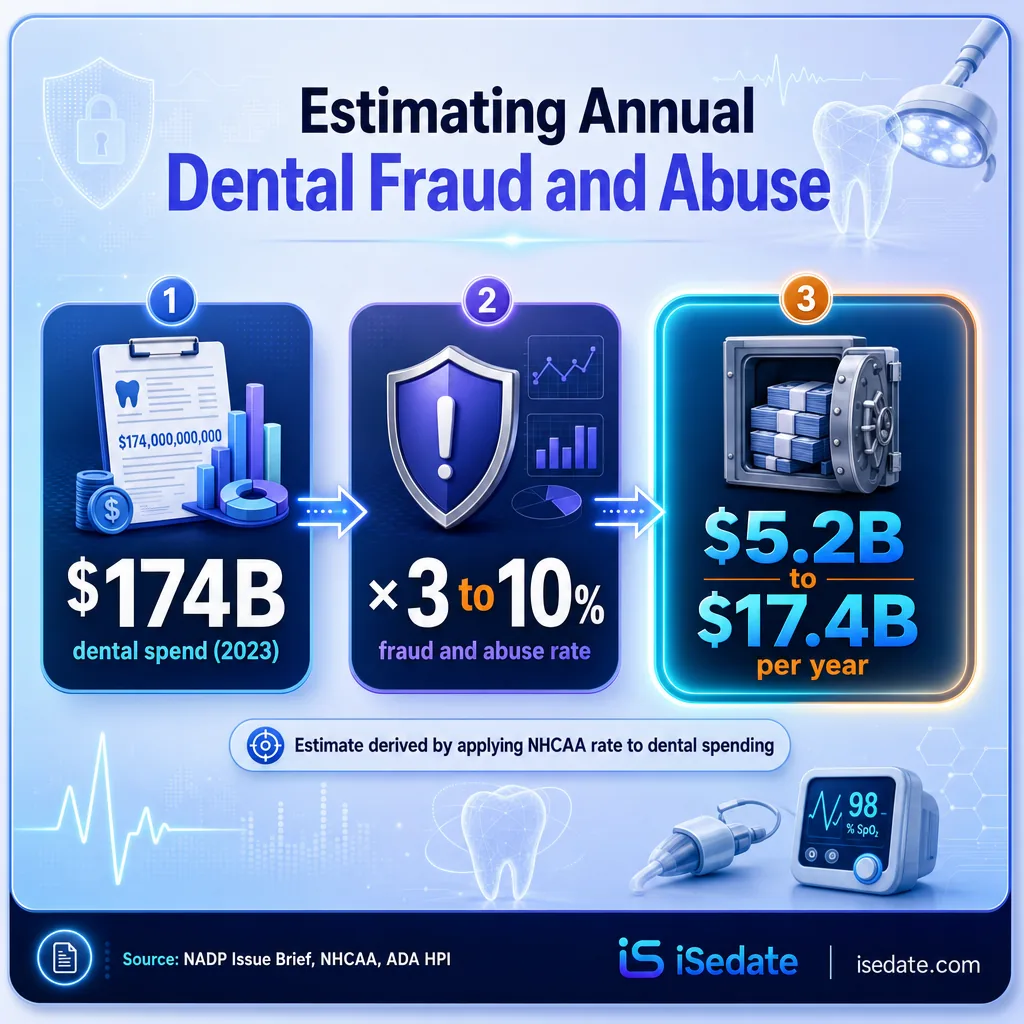
The ADA Health Policy Institute estimates that about 174 billion dollars was spent on dental treatment in 2023. The National Health Care Anti-Fraud Association estimates that roughly 3 to 10 percent of health care payments are lost to fraud and abuse. Applying that rate to dental spending, NADP calculates dental fraud and abuse at 5.2 billion dollars on the low end and 17.4 billion dollars on the high end each year.
Context: the large majority of dentists are ethical
NADP is explicit that most dentists are ethical professionals doing good work for patients, and the ADA's Code of Professional Conduct binds dentists to high standards, including that recommending or performing unnecessary services is unethical conduct. The fraud estimates describe a small subset of bad actors. The practical significance for the honest majority is different: because plans deploy outlier-detection systems to catch the few, ethical providers face increased scrutiny too, which raises the value of clean, defensible documentation for everyone.
These figures are estimates built on an applied percentage, not a direct measurement of dental claims, so they should be read as an order-of-magnitude range rather than a precise loss figure. Even the low end, 5.2 billion dollars, represents a substantial cost ultimately passed to patients through higher premiums and cost sharing.
Source: NADP Issue Brief: Addressing Fraud and Abuse in Dentistry | NHCAA
See how defensible records protect ethical practices
2 Common Fraud Scheme Types
Fraud is not one behavior. Understanding the specific scheme types clarifies both what plans look for and where honest coding errors can inadvertently mimic fraud.
According to the Office of Inspector General, billing fraud makes up nearly half of all health care fraud cases. Its main subtypes recur in dentistry: billing for services never rendered (phantom billing), upcoding to a higher-priced procedure code, unbundling procedures that should be billed together, and misrepresenting the date or type of service.
A frequently cited dental example is upcoding a routine prophylaxis (cleaning) to periodontal scaling and root planing, which carries a higher reimbursement and can open the door to additional periodontal-maintenance billing. The scheme depends on representing symptoms such as plaque or staining as periodontal disease that the record does not support, which is exactly why chart documentation is central to both committing and detecting this pattern.
Common Dental and Health Care Fraud Scheme Types
Sedation and anesthesia billing has its own exposure. In one prosecuted case, an Alaska dentist was sentenced to 12 years after authorities found he had been sedating nearly all his patients to collect the higher reimbursements paid for general anesthesia. The lesson is not that sedation is suspect, but that sedation claims must be backed by documented clinical justification, since anesthesia's higher reimbursement makes it a natural target for both fraud and for payer scrutiny of legitimate cases.
Source: NHCAA | NADP Issue Brief
Explore SedationVault, the Sedation Intelligence System
3 Fraud vs Waste vs Abuse
The industry term is FWA, fraud, waste, and abuse, and the distinctions are not academic. They determine intent, liability, and the difference between a criminal case and a correctable error.
Fraud is intentional deception or misrepresentation for unauthorized benefit, defined by three features: intent, deception, and unlawful gain. Waste is different in kind. It results from incorrect claims submission due to ignorance or lack of coding education, not deliberate deception. Most dentists are not billing-and-coding experts and rely on staff to submit claims with the correct CDT codes.
The critical point is liability. Dentists are ultimately responsible for every claim submitted in their name, whether or not they had direct knowledge of it, with potential consequences including fines, prison, and action against the dental license. That means a staff coding error, technically waste rather than fraud, still exposes the dentist. NADP's recommended safeguards are ongoing staff education, periodic internal audits, transparent patient communication, and internal controls, all of which depend on accurate underlying records.
iSedate Analysis: The documentation buffer against false flags
Consider the position of an ethical practice under outlier detection. If fraud and abuse run 3 to 10 percent of claims, then roughly 90 to 97 percent of claims are legitimate, yet outlier-detection systems flag by statistical pattern, not by guilt. An honest practice with a high sedation or periodontal mix can look like an outlier purely on volume. In that scenario, the deciding factor between a cleared review and a costly dispute is whether each flagged claim has a complete, contemporaneous record supporting it. Documentation does not just deter fraud; it protects the legitimate majority from being mistaken for it.
Formula: With fraud and abuse estimated at 3 to 10 percent of claims (NHCAA), 90 to 97 percent are legitimate, but statistical outlier detection cannot distinguish legitimate volume from fraud without claim-level documentation, making the completeness of the record the variable that resolves a review.
Calculation and interpretation original to iSedate.
Source: NADP Issue Brief
How office managers keep claims defensible
4 Enforcement and Prosecution
Federal and state enforcement against health care fraud has scaled sharply, and dentistry is not exempt, even if it draws less attention than higher-dollar medical schemes.
Since the Health Care Fraud Strike Force was created in 2007, the DOJ Health Care Fraud Unit has charged more than 5,400 defendants with fraudulently billing Medicare, Medicaid, and private insurers more than 27 billion dollars. The 2024 National Health Care Fraud Enforcement Action charged 193 defendants across schemes totaling over 2.75 billion dollars in intended losses. Enforcement is increasingly data-driven, using analytics to spot billing outliers and intervene before payment.
Dental-specific cases show the pattern. A former Maryland dentist was ordered to pay 8.5 million dollars in restitution for Medicaid fraud, and two Texas dentists and their management companies paid 3.1 million dollars to settle False Claims Act allegations tied to children's dental fillings that were never performed. Government-program fraud often carries over to commercial plans, since bad actors tend to repeat schemes across payers.
Enforcement outcomes range widely by severity: repayment demands, civil penalties, exclusion from Medicaid and Medicare, license suspension or revocation, and criminal charges in intentional cases. The trend across recent federal takedowns is toward earlier, analytics-driven intervention, with CMS increasingly preventing suspect payments up front rather than pursuing clawbacks after the fact.
Source: U.S. Department of Justice | NADP Issue Brief
Compare SedationVault plans and pricing
5 How Plans Detect Fraud
Understanding how plans find fraud explains why documentation is the practical fault line. Detection begins with statistics and ends with charts.
All government-funded dental plans are required to run a fraud, waste, and abuse program, and most commercial plans do as well, often with a dedicated special investigations unit. The detection sequence is consistent: utilization-management systems and data analytics identify outlier billing patterns, plans then audit claims by category, and clinical consultants may conduct a chart audit of the practice. If concerns remain, the plan can institute pre-payment or post-payment review requiring additional documentation with claims for a period.
NADP notes that fraud, waste, and abuse is now growing in the diagnostic category, an area not traditionally subject to heavy utilization review, which means plans are widening the patterns they monitor. Because bad actors defraud multiple payers, plans and government programs are also coordinating to detect schemes earlier across the system.
Every step after the initial statistical flag turns on the record. A chart audit, a pre-payment review, an appeal of a flagged claim, each is resolved by whether the documentation substantiates what was billed. This is the operational reason NADP frames prevention, stopping bad payments before they happen, as preferable to retroactive clawbacks: complete records at the point of care prevent both fraud and the disputes that ensnare legitimate practices. For sedation providers, where anesthesia billing draws particular scrutiny, an audit-ready record for every case is the most direct protection.
Source: NADP Issue Brief
Summary Table: All the Numbers
| Statistic | Figure | Source | Year |
|---|---|---|---|
| U.S. dental treatment spending | $174 billion | ADA HPI | 2023 |
| Estimated fraud and abuse share of payments | 3-10% | NHCAA | 2024 |
| Estimated annual dental fraud and abuse (low) | $5.2 billion | NADP | 2026 |
| Estimated annual dental fraud and abuse (high) | $17.4 billion | NADP | 2026 |
| Billing fraud share of health care fraud cases | ~50% | OIG | 2024 |
| Licensed U.S. dentists | 188,074 | ACFE | 2022 |
| Open OIG investigations of dentists | ~330 | HHS-OIG | 2022 |
| DOJ defendants charged since 2007 | 5,400+ | DOJ | 2024 |
| Total fraudulent billing charged since 2007 | $27 billion+ | DOJ | 2024 |
| 2024 national takedown defendants | 193 | DOJ | 2024 |
| 2024 takedown alleged fraud (intended) | $2.75 billion | DOJ | 2024 |
| 2024 takedown actual losses | $1.6 billion | DOJ | 2024 |
| Medicare improper payments | $31.2 billion | CMS | 2023 |
| Maryland dentist Medicaid fraud restitution | $8.5 million | NADP/Beckers | 2024 |
| Texas dentists False Claims Act settlement | $3.1 million | NADP/ACFE | 2023 |
| Alaska dentist sedation-fraud sentence | 12 years | NADP/Dr. Bicuspid | 2021 |
Frequently Asked Questions
How much money is lost to dental insurance fraud each year?
What are the most common types of dental insurance fraud?
What is the difference between fraud, waste, and abuse?
Is dental fraud investigated as much as medical fraud?
How do dental plans detect fraud?
Methodology and Sources
The dental fraud and abuse loss range ($5.2 billion to $17.4 billion) is from a NADP analysis in its February 2026 Issue Brief, which applies the National Health Care Anti-Fraud Association's 3 to 10 percent fraud-and-abuse estimate to the ADA Health Policy Institute's figure of roughly $174 billion in 2023 dental treatment spending. Scheme-type definitions and the billing-fraud share are from NHCAA and the HHS Office of Inspector General. Enforcement figures (defendants charged, dollars charged, takedown totals) are from the U.S. Department of Justice. Dental-specific case figures, the dentist-population count, and the open-investigation count are from the NADP Issue Brief, which cites the Association of Certified Fraud Examiners, Becker's Dental+DSO Review, Dr. Bicuspid, and an HHS-OIG report.
One important limitation: the headline loss range is an estimate derived by applying a broad health care fraud percentage to dental spending, not a direct measurement of fraudulent dental claims, and NHCAA itself presents the 3 to 10 percent figure as a range of estimates. The figures should be read as an order-of-magnitude range. Individual case dollar amounts reflect specific prosecutions and settlements as reported in the cited sources.
Media and press: Journalists and researchers are welcome to cite these statistics with attribution to iSedate and a link to this page. Each figure includes its original source for independent verification.