






Dental Insurance Reimbursement Rate Statistics (2026): Medicaid vs Private Data
Medicaid fee-for-service reimbursement for child dental care averaged just 39.2 percent of dentist charges in 2024, and under 60 percent of what private insurance pays, according to the ADA Health Policy Institute. Reimbursement pressure is now the single issue dentists name most often heading into 2026.
Key Takeaways
- Child Medicaid reimbursement averaged 39.2 percent of dentist charges in 2024; adult services averaged 29.9 percent (ADA HPI).
- Medicaid pays under 60 percent of private insurance reimbursement in most states (ADA HPI).
- Wide state variation: child rates as a share of private ranged from about 66.5 percent (North Dakota) to about 43.8 percent (California) (ADA HPI).
- Just 41 percent of dentists participated in Medicaid or CHIP as of 2024, flat over the past decade (ADA HPI).
- Reimbursement is not keeping up with inflation while equipment, supply, and staff costs rise, creating a fiscal squeeze (ADA HPI).
- Insurance tops the worry list: more than half of dentists named insurance issues as a top concern for 2026 (ADA HPI poll).
- Reform is accelerating: 37 dental insurance reform laws passed in 18 states in 2025 (ADA).
What's in This Guide
1 Medicaid Reimbursement vs Dentist Charges
The clearest way to see the reimbursement gap is to compare what Medicaid pays against what dentists actually charge. The ADA Health Policy Institute builds a weighted index across 14 common procedures to do exactly that.
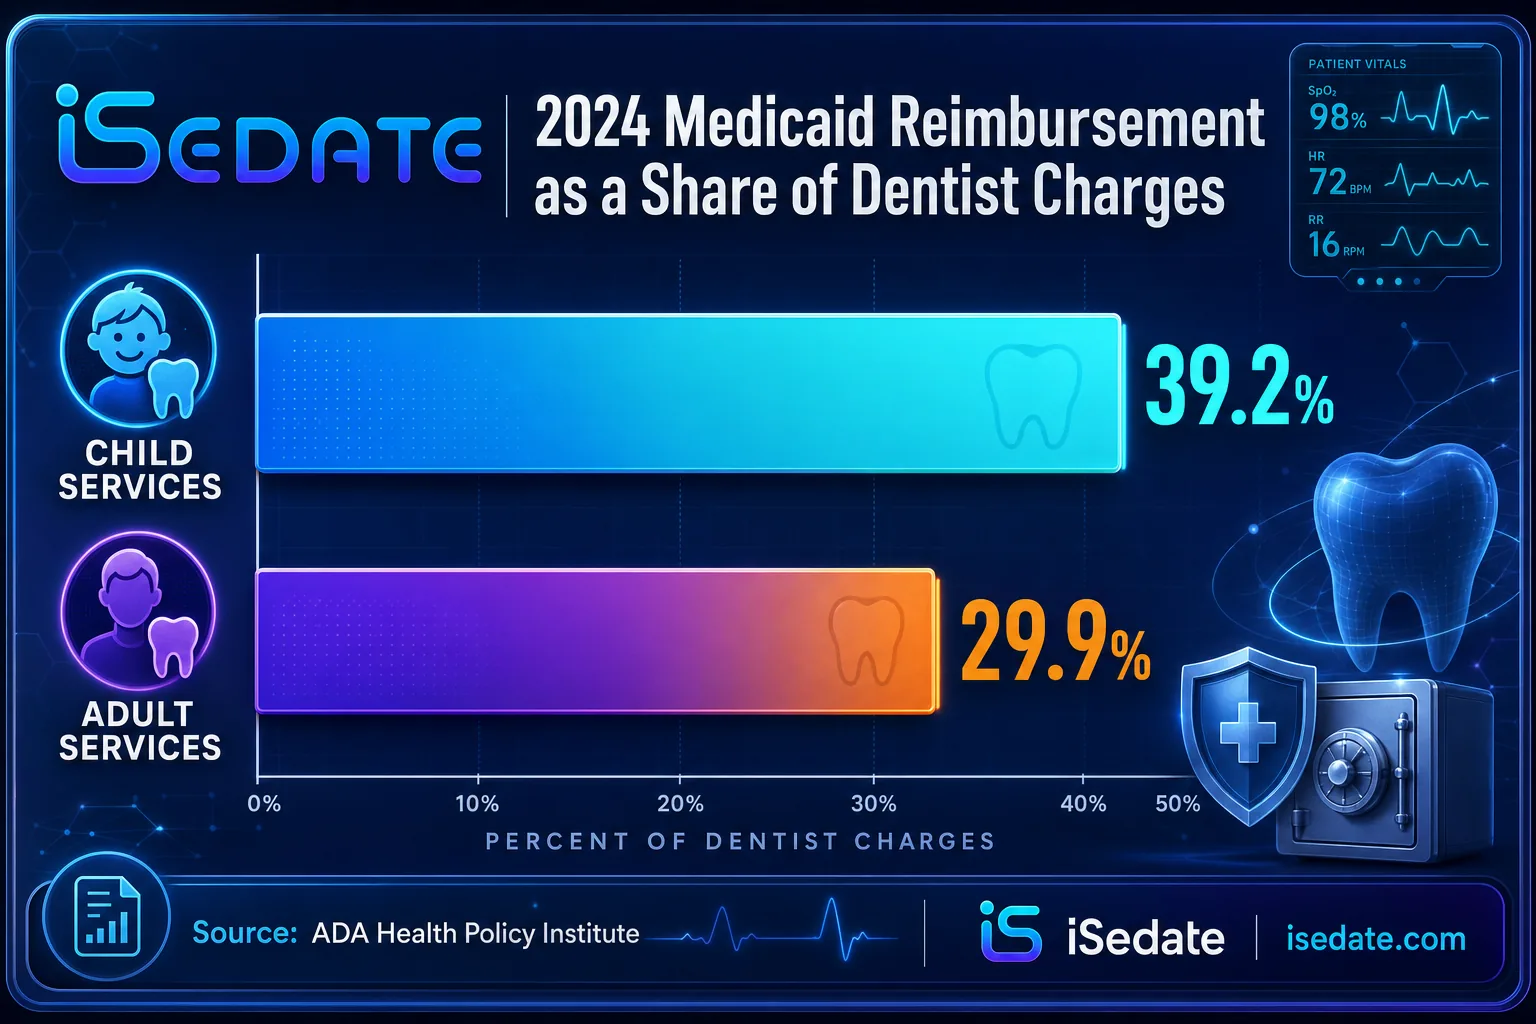
In 2024, the national average Medicaid fee-for-service reimbursement was 39.2 percent of average dentist charges for child dental services, compared with 29.9 percent for adult services. Child services are reimbursed nearly 10 percentage points higher than adult services, reflecting the federal requirement that state Medicaid programs cover dental care for children while adult coverage is optional.
A key data caveat: the managed care void
These figures reflect fee-for-service schedules only. The ADA HPI is explicit that it has no access to Medicaid managed care reimbursement data, and there is not even an up-to-date classification of how each state administers its dental program. In states where most Medicaid dental care runs through managed care, the FFS numbers are less representative. Treat the national averages as directional, and always check the specific state and delivery model before drawing conclusions.
Coverage on the front end is uneven too. While every state offers at least some reimbursement for child dental services, nine states offered no adult dental benefit or emergency-only coverage in the 2024 data.
Source: ADA Health Policy Institute, Dental Care in Medicaid Programs
See how accurate charting supports fee-schedule compliance
2 Medicaid vs Private Insurance Rates
Comparing Medicaid to private insurance, rather than to full charges, shows the gap that most directly shapes a practice's payer mix decisions.
The ADA HPI summarizes the national picture bluntly: Medicaid reimbursement in most states falls far below 50 percent of dentist charges and 60 percent of private insurance reimbursement. In practical terms, a practice accepting Medicaid is often paid less than half of its standard fee and well under what a private plan would pay for the same procedure.
For historical perspective, an earlier HPI analysis put the national Medicaid rate at about 60.9 percent of private insurance reimbursement for child dental services. Because HPI notes its 2022 and 2024 datasets are not directly comparable to earlier methodology, that figure is best read as context for the long-running direction rather than a precise trend line.
iSedate Analysis: The private-payer premium
Using the HPI benchmarks, if Medicaid pays under 50 percent of dentist charges and under 60 percent of private insurance reimbursement, then private insurance itself pays meaningfully more than Medicaid but still below full charges. Combining the two benchmarks, a Medicaid rate near 40 percent of charges (child) that also sits under 60 percent of private implies private child reimbursement lands roughly in the mid-60-percent range of full charges. This is why payer mix, the balance of private, Medicaid, and self-pay patients, is one of the strongest levers on practice revenue.
Formula: Child Medicaid at 39.2 percent of charges, constrained to be under 60 percent of private reimbursement, implies private child reimbursement of roughly 39.2 / 0.60, near 65 percent of dentist charges. Directional estimate from two HPI benchmarks.
Calculation and interpretation original to iSedate.
Source: ADA Health Policy Institute | ADA News
Explore SedationVault, the Sedation Intelligence System
3 State-by-State Variation
National averages hide enormous spread. What Medicaid pays for the same procedure can differ by 20 or more percentage points depending on the state.
For child dental services measured as a share of private insurance reimbursement, higher-paying states included North Dakota at about 66.5 percent, Alaska at 63.2 percent, and Montana at 62.0 percent, while North Carolina (52.9 percent) and California (43.8 percent) sat near the bottom. That range means a pediatric procedure reimbursed at a workable rate in one state may be paid at little more than break-even in another.
Child Medicaid Reimbursement as a Share of Private Insurance, Selected States (ADA HPI)
The takeaway for multi-state groups and practices near state lines is concrete: reimbursement is a location-specific number, not a national constant. A DSO or oral surgery group operating across state boundaries can see materially different Medicaid economics from one location to the next.
Source: ADA Health Policy Institute, Coverage, Access and Outcomes
How office managers track payer mix and documentation
4 Participation and the Reimbursement Link
Low reimbursement does not just squeeze margins. It shapes which patients can find a dentist at all, because it drives whether practices accept Medicaid in the first place.
About 41 percent of U.S. dentists participated in Medicaid or CHIP as of 2024, a share that has stayed roughly flat over the past decade even as many states expanded dental benefits. HPI links the stagnation directly to reimbursement: states with higher rates attract more participating providers, though higher participation does not automatically translate into higher utilization among beneficiaries.
The downstream effect shows up in access. Among adults, 57 percent of those with private dental benefits saw a dentist in a recent year, compared with just 18 percent of Medicaid adults. Among children, 65 percent with private insurance had a dental visit in 2023, versus 42 percent with public coverage and 23 percent with no coverage.
For sedation and oral surgery providers, participation math is especially pointed. Complex procedures carry higher costs and often require sedation, monitoring, and detailed documentation. When Medicaid reimburses those procedures well below charges, the decision to accept public coverage for high-acuity cases becomes a deliberate financial and access trade-off, not an automatic one.
Source: ADA Health Policy Institute, Dental Care in Medicaid Programs
How oral surgeons document high-acuity sedation cases
5 The Fiscal Squeeze and Reform
Reimbursement stress is not limited to Medicaid. Across payers, rates are lagging costs, and the response has moved into state legislatures.
The ADA HPI describes a fiscal squeeze: reimbursement rates for dental services are not keeping up with inflation, while prices for equipment and supplies and the wages of dental office staff are tracking with or rising faster than inflation. In a late-2025 HPI poll, more than half of dentists named insurance issues, including low reimbursement and delayed or denied payments, as a top concern for 2026.
State-level reform has accelerated in response. The ADA reports that 37 dental insurance reform laws passed in 18 states in 2025, following 16 laws in nine states in 2024. These laws target specific payer practices that erode reimbursement: downcoding, where an insurer pays for a cheaper alternative than the procedure performed; bundling, where separate procedures are combined into a single lower payment; and virtual credit card opt-in requirements that impose processing fees on providers.
Documentation is the practice-level defense
Downcoding and bundling both hinge on how a claim is coded and documented. When an insurer downgrades a porcelain crown to a metallic-crown payment or bundles procedures, the practice's recourse is a clean, well-documented appeal. With about a third of appealed denials overturned industry-wide, thorough clinical records are the most direct lever a practice controls against reimbursement erosion. Complete documentation does not raise the fee schedule, but it protects the payment the schedule promises.
Source: ADA News, Dear ADA: Reimbursement Rates | ADA Health Policy Institute
Summary Table: All the Numbers
| Statistic | Figure | Source | Year |
|---|---|---|---|
| Child Medicaid FFS reimbursement vs charges | 39.2% | ADA HPI | 2024 |
| Adult Medicaid FFS reimbursement vs charges | 29.9% | ADA HPI | 2024 |
| Child vs adult reimbursement gap | ~10 points | ADA HPI | 2024 |
| Medicaid vs dentist charges (most states) | <50% | ADA HPI | 2024 |
| Medicaid vs private reimbursement (most states) | <60% | ADA HPI | 2024 |
| North Dakota child rate vs private | 66.5% | ADA HPI | 2024 |
| Alaska child rate vs private | 63.2% | ADA HPI | 2024 |
| Montana child rate vs private | 62.0% | ADA HPI | 2024 |
| North Carolina child rate vs private | 52.9% | ADA HPI | 2024 |
| California child rate vs private | 43.8% | ADA HPI | 2024 |
| Dentists participating in Medicaid/CHIP | 41% | ADA HPI | 2024 |
| States with no or emergency-only adult benefit | 9 states | ADA HPI | 2024 |
| Private-benefit adults with a dental visit | 57% | ADA HPI | 2022 |
| Medicaid adults with a dental visit | 18% | ADA HPI | 2022 |
| Private-insured children with a dental visit | 65% | ADA HPI | 2023 |
| Public-insured children with a dental visit | 42% | ADA HPI | 2023 |
| Dentists naming insurance a top 2026 concern | 50%+ | ADA HPI poll | 2025 |
| Dental insurance reform laws passed | 37 (18 states) | ADA | 2025 |
| Dental insurance reform laws passed (prior) | 16 (9 states) | ADA | 2024 |
Frequently Asked Questions
How much does Medicaid pay dentists compared to private insurance?
What percentage of dentists accept Medicaid?
Why are dental reimbursement rates a concern for practices?
Do Medicaid reimbursement rates vary by state?
Is anything being done about low dental reimbursement?
Methodology and Sources
Reimbursement figures are from the ADA Health Policy Institute (HPI), primarily its Medicaid Reimbursement for Dental Care Services 2024 update and the Dental Care in Medicaid Programs report reflecting data available as of late 2025. HPI constructs a weighted average index across 14 procedures, comparing Medicaid fee-for-service reimbursement to average dentist charges (from FAIR Health) and to average maximum allowed payment rates in private dental plans (from Fluent). Utilization-by-insurance figures are from HPI analysis of federal survey data. Dentist participation and the fiscal-squeeze characterization are from HPI. Insurance reform law counts are from ADA advocacy reporting.
An important limitation applies throughout: HPI reimbursement figures reflect fee-for-service schedules only, and HPI has no access to Medicaid managed care reimbursement data. In states where most dental care is delivered through managed care, the FFS figures are less representative. HPI also notes that its 2022 and 2024 datasets are not directly comparable to earlier methodology, so historical figures are presented as directional context rather than a precise trend line.
Media and press: Journalists and researchers are welcome to cite these statistics with attribution to iSedate and a link to this page. Each figure includes its original Tier 1 source for independent verification.