







Dental Insurance Statistics (2026): Coverage, Enrollment, and Trends
Nearly 284 million Americans, about 83 percent of the population, carried some form of dental benefit at year-end 2024, according to the National Association of Dental Plans. Yet enrollment fell 2.3 percent year over year, and fewer than half the country actually saw a dentist. These are the numbers shaping dental coverage, plan design, and patient access heading into 2026.
Key Takeaways
- 284 million Americans had dental benefits at year-end 2024, roughly 83 percent of the population, a 2.3 percent decline from the prior year (NADP).
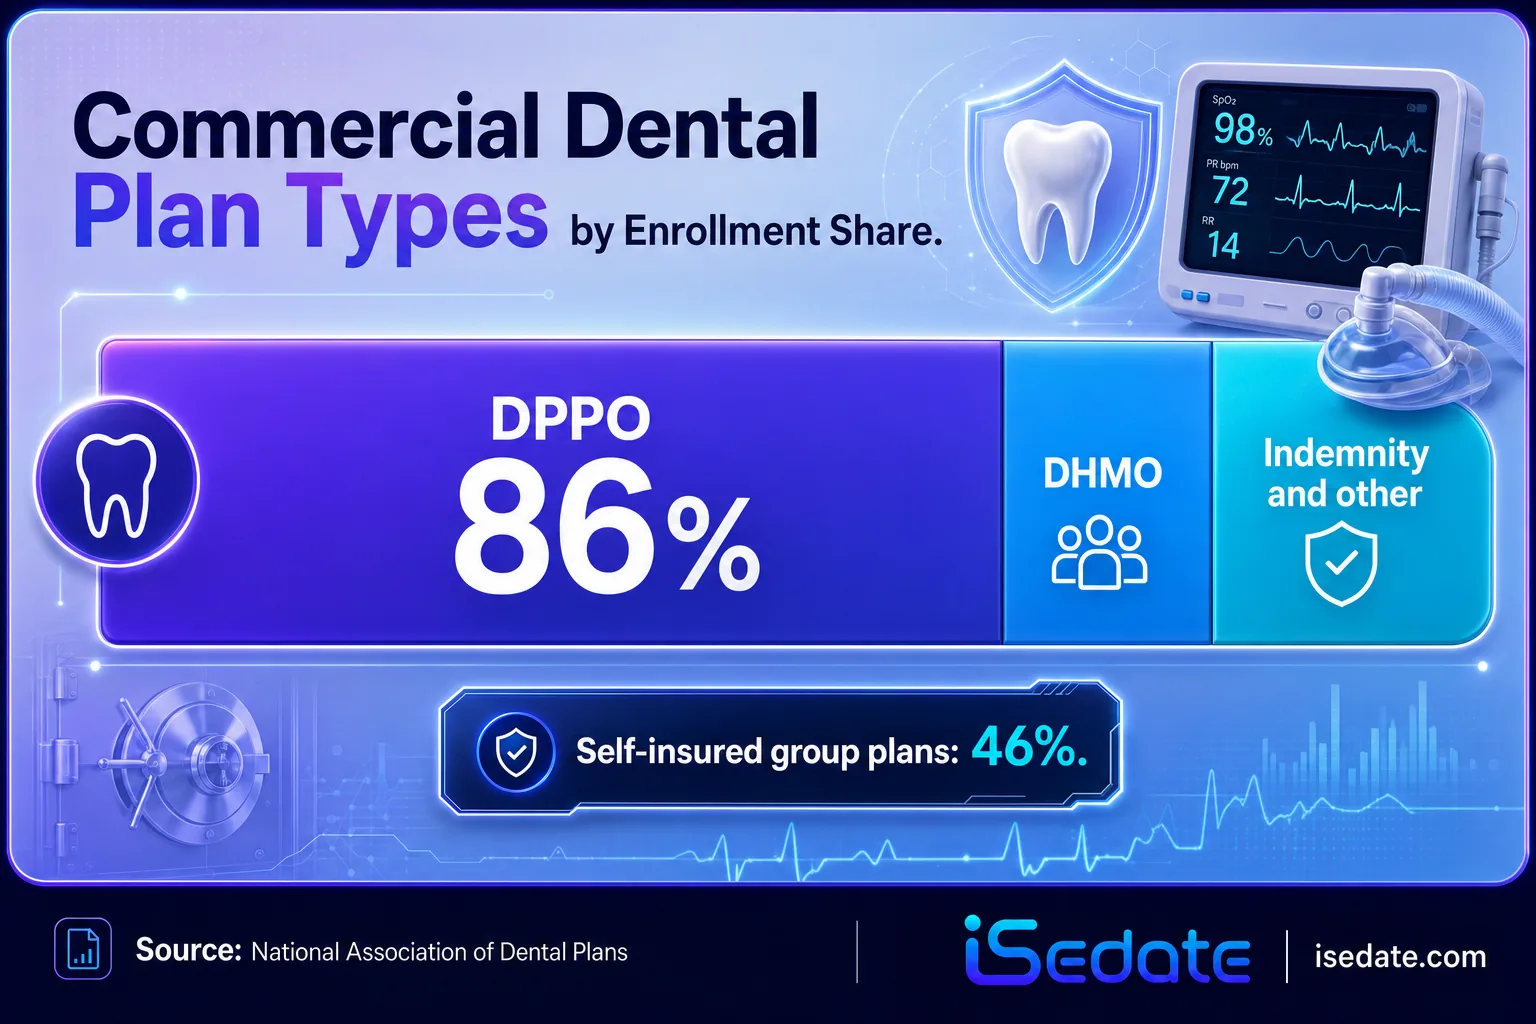
- DPPO plans dominate, holding about 86 percent of commercial dental enrollment, while DHMO and indemnity products split the remainder (NADP).
- Only 45 percent of Americans had a dental visit in 2022, dropping to 40 percent among working-age adults (ADA Health Policy Institute).
- Coverage type drives access: 57 percent of privately insured adults saw a dentist in 2022 versus 18 percent of Medicaid adults (ADA HPI).
- Employer plans anchor the market, but voluntary, employee-paid plans are the fastest-growing segment as employers shift cost-sharing (NADP).
- Cost is the top barrier: dental care poses a higher affordability barrier than medical, prescription, or mental health care (ADA HPI).
- Market concentration is high: in 11 states, the three largest dental insurers control 80 percent or more of the group market (U.S. GAO).
What's in This Guide
1 Dental Insurance Coverage and Enrollment
Dental coverage in the United States peaked and then began a measured retreat. After reaching a record 293 million covered lives at the end of 2022, enrollment slipped over the following two years as both commercial and public programs contracted.
The decline was broad. Commercial dental enrollment fell 2.0 percent compared with 2023, while publicly funded benefits dropped 3.0 percent over the same period, driven largely by post-pandemic Medicaid redeterminations. Employer-sponsored plans still provide dental benefits for more than half of all covered individuals, but the mix is shifting toward voluntary, employee-paid arrangements.
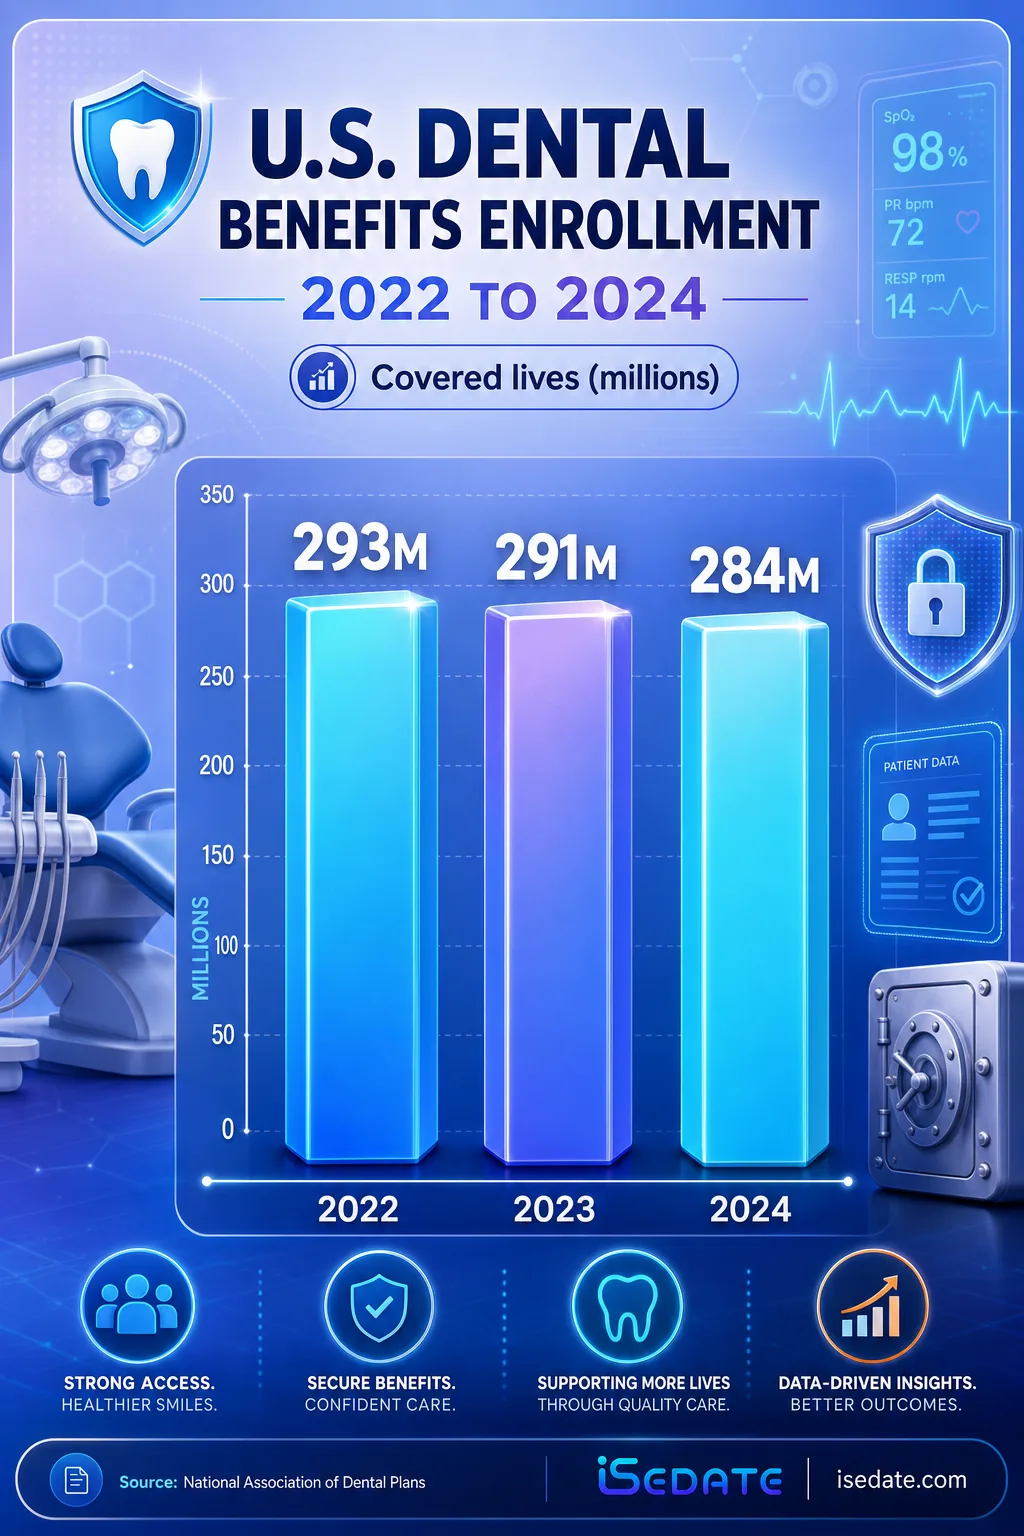
U.S. Dental Benefits Enrollment by Year (millions of covered lives)
Within the commercial market, coverage splits roughly evenly between employer-sponsored and voluntary benefits. NADP reports that about 49 percent of commercial group dental benefits are employer-sponsored and 51 percent are voluntary, paid for by individuals. Stand-alone dental plans remain the standard delivery vehicle: only about 1.2 percent of commercial dental benefits are integrated into medical policies.
Self-insurance also continues to grow. Nearly half of group dental benefits, 46 percent, are now self-insured, up from 44 percent the prior year and reversing a declining trend that ran since 2013.
Source: National Association of Dental Plans | NADP 2023 Benefits Report
See how compliance-ready records support insurance documentation
2 Plan Types and Market Structure
Not all dental plans are built the same. The commercial market is heavily weighted toward one product family, and understanding that split matters for any practice deciding which networks to join.
Dental preferred provider organization (DPPO) products are the clear market leader, holding about 86 percent of commercial enrollment. Patients favor them for the freedom to see any dentist without a referral and for negotiated in-network rates. Dental health maintenance organizations (DHMOs) and indemnity plans account for the remaining share, appealing to cost-sensitive buyers and those who want maximum provider flexibility respectively.
Market concentration is a defining feature of dental insurance. A U.S. Government Accountability Office analysis of state enrollment data found that the combined share held by the three largest dental insurers in the group market ranged from 38 percent to 97 percent across states.
Myth: Dental insurance is a competitive, fragmented market everywhere
In practice, concentration is high in much of the country. The GAO found that in 11 states, the three largest dental insurers controlled 80 percent or more of the group market, with Hawaii reaching 97 percent. For practices, that means a handful of payers often dictate reimbursement terms in any given state. Negotiating room is limited, and dropping one major network can remove a large slice of a patient base.
iSedate Analysis: The employer-sponsored coverage gap
NADP reports 83 percent of the total U.S. population holds some dental benefit, while the Bureau of Labor Statistics National Compensation Survey found 77 percent of employers offered dental coverage in 2024, up from 71 percent in 2020. Comparing these two figures shows that population coverage now outpaces employer offer rates, meaning a growing slice of coverage comes from voluntary, individual, and public sources rather than traditional employer-paid plans.
Formula: Population coverage rate (83%, NADP) measured against employer dental offer rate (77%, BLS 2024) indicates roughly 6 percentage points of coverage originating outside standard employer-paid group plans.
Calculation and interpretation original to iSedate.
Source: National Association of Dental Plans | U.S. Government Accountability Office
Explore SedationVault, the Sedation Intelligence System
3 Utilization: Who Actually Sees a Dentist
Coverage and care are not the same thing. Having a plan does not guarantee a visit, and the gap between the two is one of the most telling stories in dental data.
The ADA Health Policy Institute reports that 45 percent of the U.S. population had a dental visit in the prior 12 months in 2022. Children ages 0 to 18 and seniors 65 and older visited at a 52 percent rate, while working-age adults trailed at 40 percent.
Insurance type is the sharpest dividing line. Among adults, 57 percent of those with private dental benefits saw a dentist in 2022, compared with just 18 percent of adults covered by Medicaid. The pattern holds for children: two-thirds of children with private insurance saw a dentist, versus fewer than half of children on Medicaid or CHIP.
Dental Visit Rate by Coverage Type, Adults, 2022 (ADA HPI)
The CDC's Behavioral Risk Factor Surveillance System paints a broader picture: about 66 percent of adults reported visiting a dentist for any reason within the previous year in its 2024 survey, a figure that reflects a longer lookback and different survey design than the HPI 12-month utilization measure.
Source: ADA Health Policy Institute | CDC National Center for Health Statistics
How office managers streamline patient records and reporting
4 Market Size and Spending
The dollars behind dental insurance are large but genuinely hard to pin down. Market-size estimates vary widely by research firm, so the figures below are best read as a range rather than a single authoritative number.
NADP's State of the Market data show total dental spending rose nearly 5 percent in 2024 for both third-party payers and consumers, while dental benefits premiums increased just 0.1 percent, far below general inflation. Even with flat premiums, employees shouldered a larger share of benefit costs as employers adjusted cost-sharing under medical premium pressure.
Read market-size figures with caution
Published estimates for the U.S. dental insurance market range from roughly 88 billion to 98 billion dollars in 2025 across commercial research firms, and some reports use entirely different definitions that produce figures in the single-digit billions or the hundreds of billions. These numbers come from vendors that sell market research reports and rarely disclose full methodology. Where dollar figures are noisy, adoption and enrollment rates from NADP, ADA HPI, and federal surveys are the more reliable indicators.
On the demand side, an aging population is reshaping the market. More than 28 million Medicare Advantage members now have some dental coverage, and BLS data confirm employer dental offer rates climbed to 77 percent in 2024 from 71 percent in 2020 as employers used benefits to compete for workers.
Source: NADP 2025 State of the Market Report | ADA Health Policy Institute
Compare SedationVault plans and pricing
5 Cost Barriers and the Coverage Gap
For millions of Americans, the obstacle to dental care is not availability but affordability. Dental consistently ranks as the health service people skip most often because of cost.
The ADA Health Policy Institute finds that dental care poses the highest cost barrier of any major health service, ahead of medical care, prescription drugs, and mental health services. In NHANES data, roughly 14 percent of adults reported being unable to afford dental treatment.
Coverage status magnifies the gap. Peterson-KFF analysis shows that among lower-income adults, uninsured people are more than twice as likely as insured adults to delay or forgo care due to cost, 41 percent versus 19 percent. And an NHIS 2023 analysis found that 4.8 percent of adults ages 18 to 64, representing more than 9 million people, had either never seen a dentist or had not been in a decade or more.
The coverage gap is concentrated in specific groups. Roughly 31 percent of Medicare enrollees lack dental coverage because traditional Medicare excludes routine dental care, and about 33 percent of adults on Medicaid lack dental benefits because adult coverage is optional and varies by state. Lower-income adults face the steepest barriers: those earning under 30,000 dollars a year report significantly higher uninsured rates than higher-income peers.
Source: Peterson-KFF Health System Tracker | ADA Health Policy Institute
Summary Table: All the Numbers
| Statistic | Figure | Source | Year |
|---|---|---|---|
| Americans with dental benefits | 284 million | NADP | 2024 |
| Share of population with dental coverage | 83% | NADP | 2024 |
| Year-over-year enrollment change | -2.3% | NADP | 2024 |
| Commercial dental enrollment decline | -2.0% | NADP | 2024 |
| Public dental enrollment decline | -3.0% | NADP | 2024 |
| Peak covered lives | 293 million | NADP | 2022 |
| DPPO share of commercial enrollment | 86% | NADP | 2024 |
| Group dental benefits self-insured | 46% | NADP | 2024 |
| Commercial dental integrated with medical | 1.2% | NADP | 2024 |
| Employer-sponsored share of commercial group | 49% | NADP | 2024 |
| Population with a dental visit | 45% | ADA HPI | 2022 |
| Working-age adults with a dental visit | 40% | ADA HPI | 2022 |
| Private-benefit adults seeing a dentist | 57% | ADA HPI | 2022 |
| Medicaid adults seeing a dentist | 18% | ADA HPI | 2022 |
| Adults with a dental visit (any reason) | 66% | CDC BRFSS | 2024 |
| Total dental spending increase | ~5% | NADP | 2024 |
| Dental benefits premium increase | +0.1% | NADP | 2024 |
| Employer dental offer rate | 77% | BLS | 2024 |
| Medicare Advantage members with dental | 28 million+ | Market research | 2024 |
| Adults unable to afford dental treatment | ~14% | NHANES | 2015-2018 |
| Adults never/10+ years since dental visit | 9 million+ | NHIS | 2023 |
| States where top 3 insurers hold 80%+ of group market | 11 states | U.S. GAO | 2024 |
| Medicare enrollees lacking dental coverage | ~31% | NADP/Charm | 2024 |
Frequently Asked Questions
How many Americans have dental insurance in 2026?
What is the most common type of dental insurance plan?
What percentage of Americans visit the dentist each year?
How does dental insurance affect whether people see a dentist?
How much does cost prevent people from getting dental care?
Methodology and Sources
All figures in this article come from Tier 1 primary sources. Coverage and enrollment data are from the National Association of Dental Plans (NADP) 2025 Dental Benefits Report and 2025 State of the Market Report, reflecting industry data as of December 31, 2024. Utilization and cost-barrier data are from the American Dental Association Health Policy Institute (ADA HPI) analysis of the Medical Expenditure Panel Survey and National Health Interview Survey. Additional figures come from the CDC National Center for Health Statistics (BRFSS and NHIS), the U.S. Bureau of Labor Statistics National Compensation Survey, the U.S. Government Accountability Office, NHANES 2015-2018, and the Peterson-KFF Health System Tracker.
Market-size dollar figures vary substantially across commercial research firms and are presented as a range with the vendor-interest caveat noted in the relevant section. Where sources use different survey designs or lookback windows (for example, the 45 percent HPI 12-month rate versus the 66 percent CDC any-reason rate), those differences are stated so readers can compare like with like.
Media and press: Journalists and researchers are welcome to cite these statistics with attribution to iSedate and a link to this page. Each figure includes its original Tier 1 source for independent verification.