







Dental PPO vs HMO Statistics (2026): Enrollment, Cost, and Coverage Data
Dental preferred provider organization (DPPO) plans hold about 86 percent of commercial dental enrollment, dwarfing dental HMOs, according to the National Association of Dental Plans. The two plan types diverge sharply on premium, deductibles, and annual maximums, and those differences shape both patient choices and practice revenue.
Key Takeaways
- DPPO dominates: about 86 percent of commercial dental enrollment is in PPO plans (NADP).
- Premium gap: the average DHMO runs about 14 dollars per month versus about 35 dollars for the average DPPO (NADP).
- No maximum on most DHMOs: 88 percent of DHMO enrollees had no annual maximum in 2024, up from 78 percent in 2023 (NADP).
- Rollovers rising: 42 percent of PPO enrollees now receive an annual maximum benefit rollover (NADP).
- Low deductibles: only 3 percent of PPO enrollees are in plans with a deductible of 100 dollars or more (NADP).
- Usage is climbing: commercial enrollees averaged 3.28 services per patient in 2024, up from 3.17 in 2022 (NADP/Fluent).
- More hitting the cap: the share of DPPO group enrollees reaching their annual maximum rose to 2.9 percent, a six-year high (NADP).
What's in This Guide
1 Enrollment: How the Market Splits
The dental insurance market is not an even contest between PPO and HMO. One plan type has taken a commanding share of commercial enrollment, and the gap has held for years.
Dental preferred provider organization products are the clear leader, making up about 86 percent of total enrollment in commercial dental plans. DHMOs serve a distinct minority of consumers, alongside indemnity and dental savings plans. The National Association of Dental Plans has tracked enrollment by product type since 1994, and PPO dominance has been a durable feature of that record.
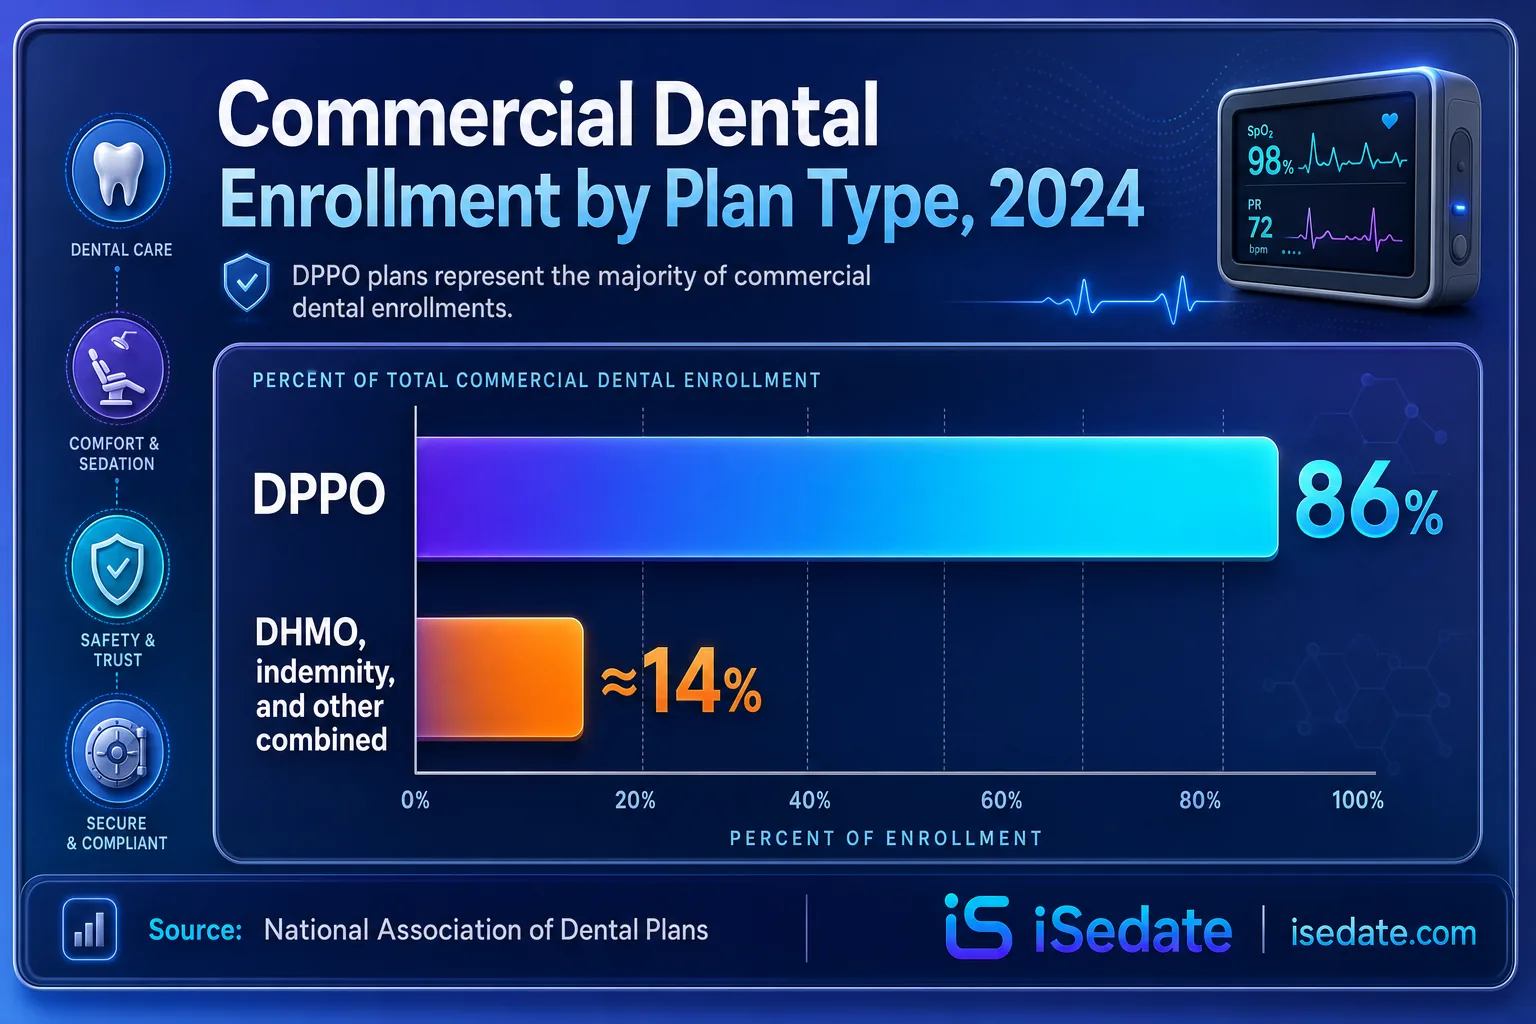
Commercial Dental Enrollment by Plan Type (NADP)
The reason for PPO dominance is structural. DPPO plans match how most independent practices operate: fee-for-service reimbursement, broad networks, out-of-network options, and no primary-dentist gatekeeping. DHMOs, built around capitation and restricted networks, appeal to cost-sensitive buyers but fit a narrower slice of the market. For employers assembling benefits, PPO flexibility is usually the easier sell.
Underneath the commercial split, the total covered population sits at about 83 percent of Americans, with roughly 284 million people holding some dental benefit as of year-end 2024. PPO and HMO are the two most common commercial delivery vehicles within that total.
Source: National Association of Dental Plans
See how dentists standardize records across plan types
2 Cost: Premiums, Deductibles, and Copays
Cost is where the two plan types separate most cleanly. DHMOs are built to be cheap and predictable; DPPOs cost more but buy flexibility.
The average DHMO premium runs about 14 dollars a month, while the average DPPO costs roughly 35 dollars, a difference of about 150 percent. DHMOs generally carry no deductible and replace percentage coinsurance with fixed copays, such as a flat 25 dollars for a filling, making patient costs predictable up front.
Average Monthly Premium by Plan Type (NADP)
Where DPPOs do carry deductibles, they stay low. Only 3 percent of PPO enrollees are in plans with a deductible of 100 dollars or more. The most common deductible for large-group DPPO enrollees falls in the 50 to 99 dollar range, applying to about 58 percent of them, while large-group indemnity enrollees most often see deductibles under 25 dollars.
Myth: HMO plans are always the better financial deal
Lower premium does not always mean lower total cost. DHMOs restrict patients to a smaller network and require referrals for specialists, so a patient with an established dentist outside the network, or one needing frequent specialist care, can end up paying full price out of network or facing referral delays. The 14-dollar premium is only a bargain if the patient's needs fit the plan's narrow structure. For families and patients with existing providers, the DPPO's higher premium often buys real savings through choice and access.
Source: National Association of Dental Plans, Plan Design Report
Compare SedationVault plans and pricing
3 Coverage Design: Maximums and Rollovers
Annual maximums are one of the defining structural differences between the two plan types, and the data show both plans evolving to expand consumer protection.
Dental HMOs generally do not impose annual maximums. NADP reports that 88 percent of DHMO enrollees had no annual maximum in 2024, up from 78 percent the prior year. That structure benefits patients facing major work, since there is no cap on covered benefits, though the trade-off is the plan's narrower network and referral rules.
DPPO plans typically do carry an annual maximum, but carriers have been adding a consumer-friendly feature. About 42 percent of PPO enrollees now receive an annual maximum benefit rollover, which carries some unused benefit dollars from one year into the next to increase available coverage.
iSedate Analysis: The maximum squeeze
The share of DPPO group enrollees reaching their annual maximum climbed from 1.7 percent to 2.9 percent, the highest in six years. NADP data show why: commercial enrollees used 3.28 services per patient in 2024, up from 3.17 in 2022, while the average undiscounted fee per treatment rose from 176 dollars in 2022 to 188 dollars in 2024. More services at higher fees push more patients toward a fixed cap.
Formula: Rising services per patient (3.17 to 3.28, 2022 to 2024) multiplied by rising fee per treatment (176 dollars to 188 dollars) increases total annual benefit consumption faster than static or slowly-rising annual maximums, raising the share hitting the cap from 1.7% to 2.9%.
Calculation and interpretation original to iSedate.
Source: National Association of Dental Plans, Plan Design Report
See how compliance-ready records support benefit documentation
4 Access: Networks and Referrals
Beyond dollars, the plans differ on how freely a patient can choose and reach care. This is the flexibility trade-off at the heart of the PPO vs HMO decision.
DPPO plans let patients see any licensed dentist, with the strongest benefits in network but real out-of-network coverage available. Specialist care generally requires no referral, so a patient needing an endodontist or oral surgeon can book directly. DHMO plans restrict patients to a smaller contracted network, usually assign a primary care dentist, and require that primary dentist to refer the patient to an in-network specialist.
Access to newer care modalities is broad in the PPO market. NADP reports that 95.1 percent of DPPO enrollees in the large-group market had access to teledentistry in 2024, reflecting how quickly virtual consults have become a standard plan feature.
For oral surgeons and sedation providers specifically, the referral distinction matters. A DHMO patient needing IV sedation for a complex extraction may face a referral step and network constraints before treatment, while a DPPO patient can typically schedule directly with the surgeon of their choice. That difference affects both patient wait times and the referral patterns a practice sees.
Source: National Association of Dental Plans, Plan Design Report
How oral surgeons document IV sedation cases
5 Usage and Practice Impact
Plan type is not just a patient decision. It shapes the revenue mix, documentation load, and reimbursement patterns a practice manages every day.
Commercial dental utilization is rising steadily. Enrollees averaged 3.17 services per year in 2022, 3.23 in 2023, and 3.28 in 2024, with a forecast of 3.35 for 2025. Over the same period, the estimated undiscounted fee per treatment climbed from 176 dollars to 188 dollars, forecast to reach 194 dollars in 2025. More services at higher fees mean more claims, more documentation, and more benefit dollars flowing through practices.
Because DPPO plans account for the large majority of commercial enrollment, most practices see a PPO-weighted patient base with fee-for-service claims, deductibles, and annual maximums to track. DHMO patients, where present, bring fixed copays and capitation arrangements that behave differently in the revenue cycle. Understanding the mix helps a practice forecast collections and staffing for insurance administration.
Whichever plan types a practice accepts, the common denominator is documentation. Fee-for-service DPPO claims and DHMO copay arrangements both depend on accurate, complete records to justify treatment and support any appeal. Clean charting is the throughline across every plan design.
Source: National Association of Dental Plans, Plan Design Report
Summary Table: All the Numbers
| Statistic | Figure | Source | Year |
|---|---|---|---|
| DPPO share of commercial enrollment | 86% | NADP | 2024 |
| Average DHMO monthly premium | ~$14 | NADP | 2024 |
| Average DPPO monthly premium | ~$35 | NADP | 2024 |
| DHMO enrollees with no annual maximum | 88% | NADP | 2024 |
| DHMO enrollees with no annual maximum (prior year) | 78% | NADP | 2023 |
| PPO enrollees with benefit rollover | 42% | NADP | 2024 |
| PPO enrollees with deductible of $100+ | 3% | NADP | 2024 |
| Large-group DPPO enrollees with $50-$99 deductible | 58% | NADP | 2024 |
| Large-group indemnity enrollees with deductible under $25 | 79% | NADP | 2024 |
| DPPO group enrollees reaching annual maximum | 2.9% | NADP | 2024 |
| DPPO group enrollees reaching maximum (prior) | 1.7% | NADP | 2023 |
| Large-group DPPO enrollees with teledentistry access | 95.1% | NADP | 2024 |
| Average services per commercial enrollee | 3.28 | NADP/Fluent | 2024 |
| Average services per enrollee (2022) | 3.17 | NADP/Fluent | 2022 |
| Forecast services per enrollee | 3.35 | NADP/Fluent | 2025 |
| Average undiscounted fee per treatment | $188 | NADP/Fluent | 2024 |
| Undiscounted fee per treatment (2022) | $176 | NADP/Fluent | 2022 |
| Total U.S. population with dental coverage | 83% | NADP | 2024 |
Frequently Asked Questions
What percentage of dental enrollment is PPO vs HMO?
Is a dental PPO or HMO cheaper?
Do dental HMO plans have an annual maximum?
Why do most dentists prefer PPO patients?
What are the main differences between dental PPO and HMO plans?
Methodology and Sources
All plan-design, enrollment, premium, deductible, annual-maximum, and utilization figures are from the National Association of Dental Plans (NADP), primarily its 2025 Dental Benefits Report: Plan Design and 2025 Enrollment Report, reflecting industry data as of year-end 2024. Utilization and fee-per-treatment trends draw on NADP's reporting of Fluent claims data. Average premium figures of about 14 dollars for DHMO and 35 dollars for DPPO are NADP figures as cited in carrier consumer materials.
Plan-feature descriptions, such as referral requirements, network structure, and deductible mechanics, reflect the standard design of each plan type as documented by NADP and major carriers. Individual plans vary, and the figures represent market averages rather than any single plan. The 86 percent DPPO enrollment share is scoped to the commercial dental market and excludes public programs such as Medicaid, CHIP, and Medicare Advantage.
Media and press: Journalists and researchers are welcome to cite these statistics with attribution to iSedate and a link to this page. Each figure includes its original Tier 1 source for independent verification.