







Health Insurance Coverage Statistics (2026): US Coverage by the Numbers
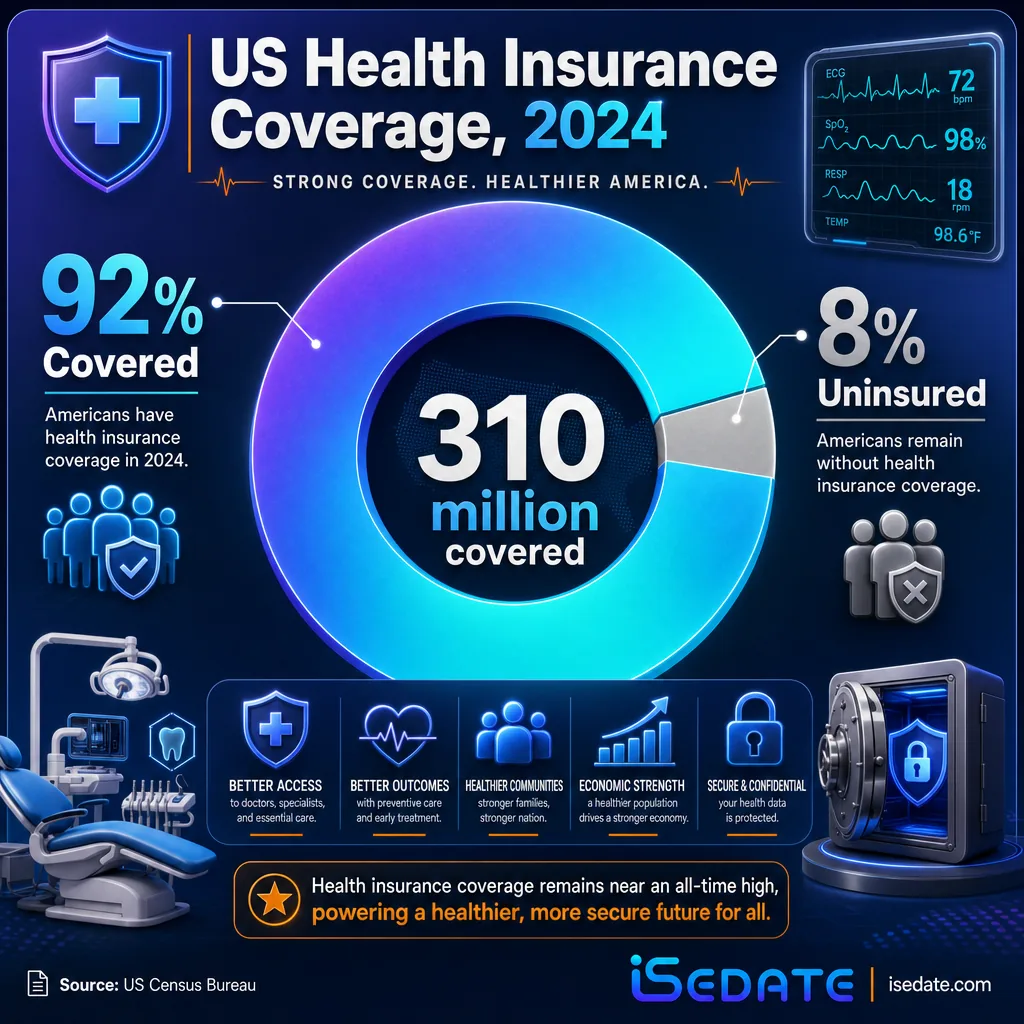
About 92 percent of Americans, roughly 310 million people, had health insurance in 2024, leaving an 8 percent uninsured rate, according to the U.S. Census Bureau. But the headline conceals softer spots: nearly a quarter of working-age adults are underinsured, and dental coverage lags health coverage by a wide margin.
Key Takeaways
- 92% covered, 8% uninsured: about 310 million Americans had health insurance in 2024 (Census).
- Employer coverage dominates: 53.8 percent of people, part of 66.1 percent with any private coverage (Census).
- Public coverage 35.5%: Medicare 19.1 percent and Medicaid 17.8 percent lead (Census).
- 27.1 million uninsured at a point in early 2024 by the CDC's survey measure (CDC NHIS).
- Working-age adults most exposed: 11.6 percent of adults 19 to 64 were uninsured in 2024 (CDC).
- Underinsurance is common: 23 percent of working-age adults were underinsured (Commonwealth Fund).
- Dental lags health: 8 percent lack health insurance versus about 27 percent lacking dental coverage (Census/CareQuest).
What's in This Guide
1 Overall US Coverage
Health coverage in the United States reached a broad plateau in 2024. The overall numbers are stable, but stability is not the same as universality.
The U.S. Census Bureau's annual coverage report found that about 92 percent of Americans, roughly 310 million people, were enrolled in health insurance during 2024. The corresponding 8 percent uninsured rate was statistically on par with 2023, following roughly a decade of coverage gains under the Affordable Care Act.
That plateau followed a notable churn beneath the surface. The Medicaid continuous-coverage requirement from the pandemic ended in 2023, and states spent the following 14 months resuming normal eligibility redeterminations. As a result, Medicaid enrollment declined into 2024 while direct-purchase and marketplace coverage rose, partly offsetting the shift, which is why the top-line rate held steady even as coverage sources reshuffled.
Note: different surveys give slightly different numbers
Coverage statistics vary by source because the surveys measure different things. The Census Bureau's Current Population Survey uses a full-calendar-year definition (uninsured means no coverage all year), producing the 8 percent figure. The CDC's National Health Interview Survey uses a point-in-time measure, producing about 8.2 percent, or 27.1 million people, in early 2024. The Commonwealth Fund's survey reports 9 percent. None is wrong; they answer slightly different questions, so the right figure depends on whether you want a full-year, point-in-time, or affordability-focused view.
Source: U.S. Census Bureau
How office managers verify coverage and eligibility
2 Coverage by Source
Where Americans get their coverage matters as much as whether they have it. The US system is a patchwork dominated by employment, with public programs filling large but incomplete gaps.
Private coverage accounted for 66.1 percent of people in 2024, with employer-sponsored insurance the single largest source at 53.8 percent. Direct-purchase coverage, including marketplace plans, covered 10.7 percent, up from 10.2 percent a year earlier. Public coverage reached 35.5 percent overall, led by Medicare at 19.1 percent and Medicaid at 17.8 percent. Because a person can hold more than one type during the year, these categories overlap and sum to more than 100 percent.
US Health Coverage by Source, 2024 (share of people, overlapping)
The dominance of employer coverage explains much of the system's fragility. When people change or lose jobs, retire, or age into Medicare, their coverage source shifts, and each transition is a moment where gaps can open. The direct-purchase marketplace has grown as a backstop, but its affordability depends heavily on enhanced premium subsidies scheduled to expire at the end of 2025.
Source: U.S. Census Bureau coverage report
Explore SedationVault, the Sedation Intelligence System
3 The Uninsured
The uninsured are not a random slice of the population. Coverage gaps concentrate by age, income, and state policy, and the near-term trend may reverse recent gains.
The CDC's National Health Interview Survey found 27.1 million people uninsured at a point in early 2024. Working-age adults are the most exposed: 11.6 percent of adults aged 19 to 64 were uninsured in 2024, compared with much lower rates for children and seniors, because working-age adults do not qualify for children's programs like CHIP and rarely qualify for Medicare. Uninsured rates were consistently lower in states that expanded Medicaid under the ACA.
The child uninsured rate also rose for a second straight year, reaching about 5.1 to 6.0 percent depending on the survey, a reversal of prior progress that analysts link to the end of pandemic-era Medicaid continuous coverage. Looking ahead, the Congressional Budget Office projects that roughly 10 million more people could become uninsured by 2034 under recent policy changes, which the KFF describes as potentially reversing more than a decade of ACA coverage gains.
These projections turn on two policy levers in particular: the expiration of enhanced marketplace premium subsidies at the end of 2025, which the Commonwealth Fund estimates would raise the average marketplace premium by 705 dollars and push about 4 million people out of coverage, and new Medicaid eligibility rules. The near-term direction of the uninsured rate depends heavily on how these play out.
Source: CDC National Health Interview Survey
How oral surgeons handle self-pay and mixed coverage
4 Underinsurance and Coverage Gaps
Having a card in your wallet is not the same as being able to afford care. This is the coverage story the headline uninsured rate misses entirely.
The Commonwealth Fund's 2024 Biennial Health Insurance Survey found that only 56 percent of working-age adults were insured all year with coverage adequate to ensure affordable access to care. Beyond the 9 percent uninsured, 12 percent had a gap in coverage during the year, and 23 percent were underinsured, meaning they held coverage for a full year that still did not provide affordable access.
Underinsurance is not confined to one part of the system. Among underinsured adults, about 66 percent had employer coverage, 16 to 17 percent were in Medicaid or Medicare, and roughly 14 percent had marketplace or individual-market plans. The common thread is cost sharing: high deductibles, copays, and out-of-pocket maximums that leave insured people rationing care. This is largely driven by growth in overall health care spending, with US provider prices to commercial insurers among the highest in the world.
iSedate Analysis: Coverage is a spectrum, not a switch
Combining the Commonwealth Fund's categories reveals that being fully, adequately covered is a minority experience for working-age adults. Only 56 percent are insured all year with adequate coverage, meaning 44 percent are uninsured, experience a coverage gap, or are underinsured at some point. The 8 percent headline uninsured rate captures less than a fifth of the population facing meaningful coverage problems. For any provider quoting a patient's out-of-pocket cost, the practical takeaway is that an insurance card says little about what the patient can actually afford.
Formula: 100 percent minus 56 percent adequately insured all year equals 44 percent of working-age adults who are uninsured (9 percent), gapped (12 percent), or underinsured (23 percent) at some point, versus the 8 to 9 percent uninsured headline.
Calculation and interpretation original to iSedate.
Source: Commonwealth Fund
Compare SedationVault plans and pricing
5 How Dental Coverage Compares
For dental and oral surgery practices, the health coverage picture is the backdrop against which dental sits, and the contrast is stark.
The most important comparison for a dental practice is the gap between health and dental coverage. About 8 percent of adults lack health insurance, but roughly 27 percent of adults lack dental insurance, nearly three times higher. The federal surveys underscore why: the Census Bureau explicitly defines comprehensive health coverage to exclude single-service plans such as dental and vision, and the CDC counts someone with only a dental-type plan as uninsured for health purposes. Dental is treated as a separate benefit throughout the system.
That structural separation is the root of the wider dental gap. Traditional Medicare excludes routine dental care, adult Medicaid dental benefits are optional by state, and dental is often an add-on rather than a core benefit in private plans. So even as health coverage sits near a historic high, dental coverage remains far patchier, which shapes how dental practices handle payment, financing, and self-pay patients every day.
Why this matters for dental practices
Because dental coverage is thinner and more variable than health coverage, dental and oral surgery practices see a higher share of self-pay and partially covered patients than a medical practice would. Add underinsurance, where nearly a quarter of insured adults still cannot easily afford care, and a large portion of the patient base is cost-sensitive regardless of whether they hold a card. Accurate benefit verification and clear cost communication are not administrative niceties in this environment; they are central to both collections and patient trust.
Source: U.S. Census Bureau | CareQuest Institute
Summary Table: All the Numbers
| Statistic | Figure | Source | Year |
|---|---|---|---|
| Americans with health insurance | 92% (~310M) | Census | 2024 |
| Uninsured rate (full-year) | 8% | Census | 2024 |
| People uninsured (point-in-time) | 27.1 million | CDC NHIS | 2024 |
| Any private coverage | 66.1% | Census | 2024 |
| Employer-sponsored coverage | 53.8% | Census | 2024 |
| Any public coverage | 35.5% | Census | 2024 |
| Medicare | 19.1% | Census | 2024 |
| Medicaid | 17.8% | Census | 2024 |
| Direct-purchase coverage | 10.7% | Census | 2024 |
| Adults 19 to 64 uninsured | 11.6% | CDC NHIS | 2024 |
| Children uninsured (NHIS) | 5.1% | CDC NHIS | 2024 |
| Working-age adults adequately insured all year | 56% | Commonwealth Fund | 2024 |
| Working-age adults underinsured | 23% | Commonwealth Fund | 2024 |
| Adults with a coverage gap in the year | 12% | Commonwealth Fund | 2024 |
| Projected additional uninsured by 2034 | 10 million | CBO | 2034 |
| Adult dental uninsured rate (for comparison) | ~27% | CareQuest | 2024 |
Frequently Asked Questions
How many Americans have health insurance?
What is the most common source of health insurance in the US?
How many Americans are uninsured?
What does underinsured mean and how common is it?
How does health insurance coverage compare to dental coverage?
Methodology and Sources
Overall coverage, uninsured rate, and coverage-by-source figures are from the U.S. Census Bureau's Health Insurance Coverage in the United States: 2024 report, based on the Current Population Survey Annual Social and Economic Supplement (CPS ASEC) and the American Community Survey. Point-in-time uninsured figures and age-group breakdowns are from the CDC's National Health Interview Survey (NHIS) Early Release program. Underinsurance and coverage-gap figures are from the Commonwealth Fund's 2024 Biennial Health Insurance Survey. Projections of future uninsured counts are from the Congressional Budget Office as reported by KFF. The dental comparison figure is from CareQuest Institute's State of Oral Health Equity in America survey.
Coverage estimates differ across surveys because they use different definitions: the Census full-year measure, the CDC point-in-time measure, and the Commonwealth Fund affordability-focused measure each answer a slightly different question, which is why the uninsured rate appears as 8, 8.2, or 9 percent depending on the source. Coverage-by-source percentages sum to more than 100 percent because individuals can hold multiple coverage types during a year. Figures reflect the most recent full-year data available and are subject to survey sampling limitations noted by each agency.
Media and press: Journalists and researchers are welcome to cite these statistics with attribution to iSedate and a link to this page. Each figure includes its original Tier 1 source for independent verification.