







Health Insurance and Medical Liability Statistics (2026): Claims and Payouts
Medical malpractice payments reached about 5.02 billion dollars in 2024, and roughly 29 percent of physicians are sued at some point in their careers, according to AMA and National Practitioner Data Bank data. Yet most claims never result in a payment, which makes the quality of the medical record the deciding factor in defense.
Key Takeaways
- $5.02 billion in medical malpractice payments in 2024 (NPDB).
- ~29% of physicians sued in their careers, rising to about 45 percent over age 55 (AMA).
- Most claims close with no payment: about 65 percent are dropped, dismissed, or withdrawn (AMA).
- Defendants win most trials: around 89 percent of claims reaching a verdict are won by the physician (AMA).
- Specialty drives risk: surgeons and OB/GYNs face the highest claim frequency; dermatology and psychiatry the lowest (AMA).
- Premiums rising 7 straight years: about 39.9 percent of premiums increased in 2025 (AMA).
- Malpractice is a small share of litigation: under 5 percent of pending personal-injury cases (NCSC).
What's in This Guide
1 How Often Physicians Are Sued
Malpractice risk is a career-long reality for clinicians, but it is far from uniform. Age and specialty shape the odds more than almost any other factor.
The AMA's Medical Liability Claim Frequency research, based on nationally representative benchmark surveys, finds that roughly 29 percent of physicians have been sued during their careers. Because risk accumulates with years in practice, the figure rises to about 45 percent for physicians over age 55. Notably, that older-cohort figure has edged down from earlier estimates near 50 percent, as younger physicians face lower claim frequency overall.
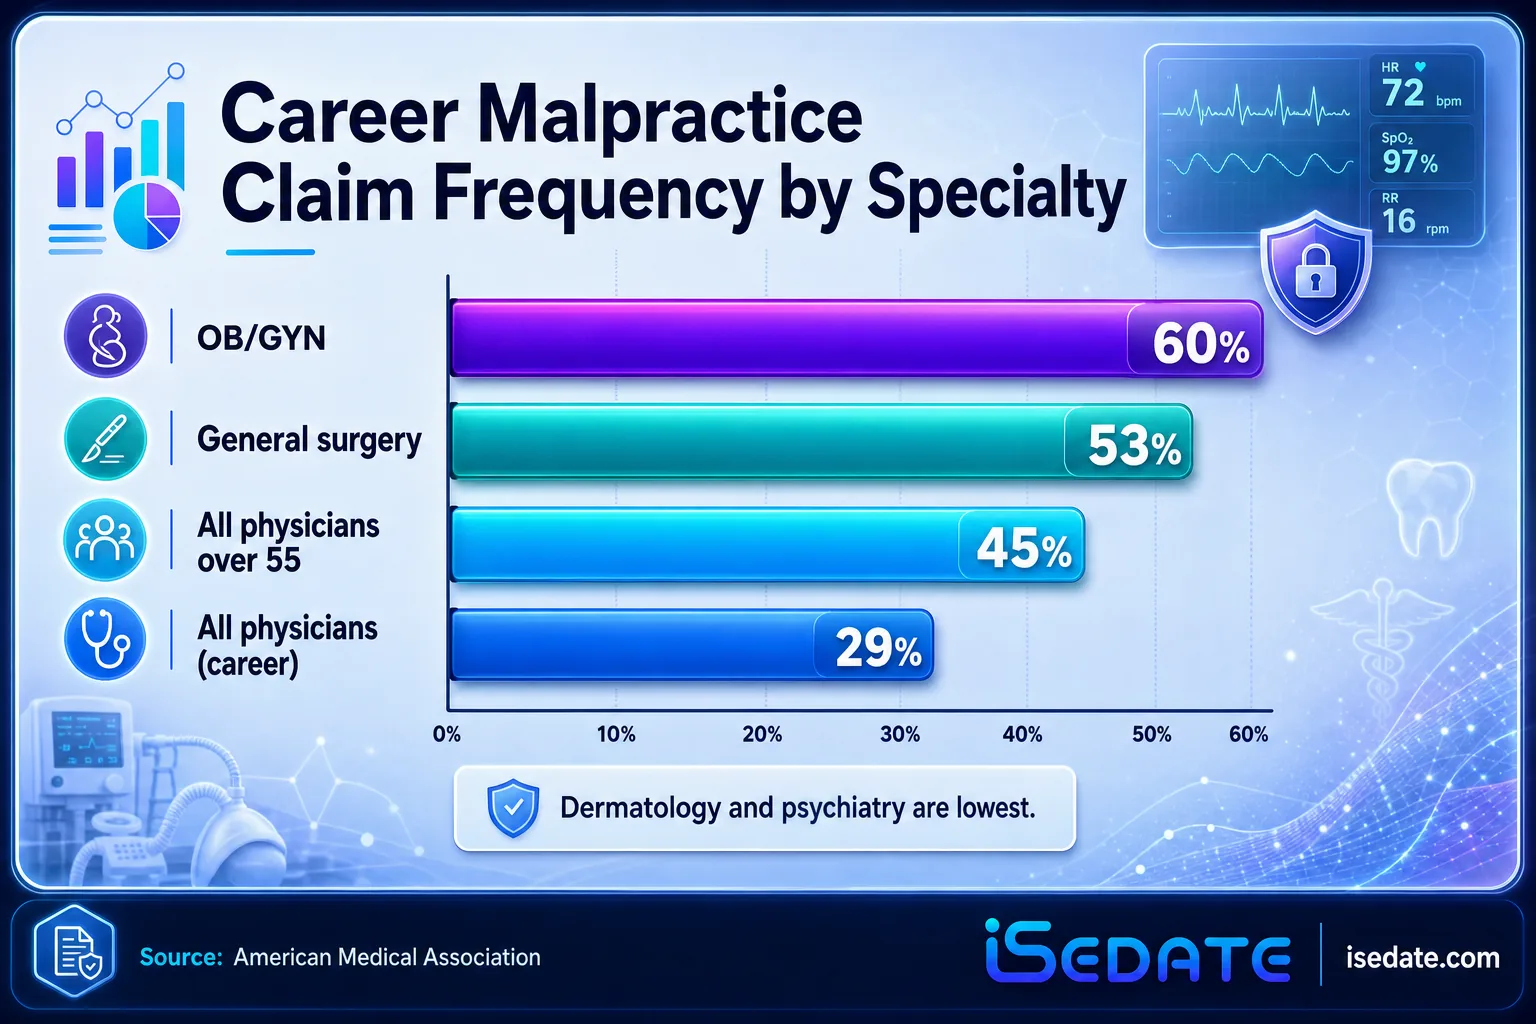
Specialty is the sharpest divider. AMA data put career claim rates around 53 percent for general surgeons and 60 percent for OB/GYN physicians, while dermatologists and psychiatrists face the lowest rates. The pattern tracks procedural risk: specialties involving surgery, anesthesia, and high-stakes time-sensitive decisions carry more exposure than those that do not.
Note: "sued" is not the same as "at fault"
Claim frequency measures whether a physician faced a claim, not whether an error occurred. The AMA is explicit that getting sued is not necessarily indicative of medical error, since the majority of claims are ultimately dropped or dismissed. Different sources also report different figures because they define a claim differently: surveys that count any legal involvement produce higher numbers than data tracking only formal paid claims. The figures here describe exposure to the liability system, not a rate of negligence.
Source: American Medical Association
How oral surgeons document high-acuity cases
2 How Claims Resolve
The most misunderstood part of malpractice is what happens after a claim is filed. The large majority never reach a courtroom, and of those that do, physicians usually prevail.
According to AMA analysis of claims closed between 2016 and 2018, about 65 percent were dropped, dismissed, or withdrawn without payment. Only around 6 percent of claims were decided by a trial verdict at all, and of those, roughly 89 percent were won by the defendant physician. Most of the remainder settle before trial. Broader analyses consistently find that a large majority of claims, on the order of four in five, do not result in a payment to the claimant.
How Medical Malpractice Claims Resolve (AMA, claims closed 2016-2018)
This resolution pattern matters for how physicians should think about risk. The high dismissal rate reflects two things at once: many claims lack merit, but it is also genuinely difficult for patients to prove malpractice, which requires establishing that care fell below the standard and caused harm. Both realities point to the same practical lever, which is the strength of the documented record supporting the care provided.
Source: American Medical Association
See how audit-ready records support a defense
3 Payouts and Totals
When claims do result in payment, the amounts are substantial and the national totals large. But averages hide a highly skewed distribution.
The National Practitioner Data Bank, the federal repository that tracks paid malpractice reports, recorded about 5.02 billion dollars in medical malpractice payments in 2024. The average payout per paid claim was approximately 439,000 dollars, though the median is considerably lower. Over the decade from 2013 to 2023, total payments exceeded 34 billion dollars, averaging roughly 8,400 paid reports a year.
The distribution is heavily skewed. Of roughly 11,440 claims reported to the NPDB for 2023, the largest single group, around 3,200, resolved for less than 100,000 dollars, while only about 1,300 exceeded 1 million dollars. A small number of very large awards pull the average well above the typical claim, which is why average and median payouts differ so much.
The NPDB only counts paid claims
An important measurement caveat: the NPDB records only claims where an indemnity payment was made. Because the vast majority of claims, on the order of 72 percent, involve no payment at all, the NPDB captures only a fraction of total claim activity. This is precisely why the AMA relies on nationally representative benchmark surveys, which include both paid and unpaid claims, to measure how often physicians are actually sued. Payout totals and claim-frequency rates come from different datasets measuring different things.
Source: National Practitioner Data Bank data | American Medical Association
Explore SedationVault, the Sedation Intelligence System
4 Rising Liability Premiums
Even though claim frequency has been broadly stable, the cost of coverage has been climbing, a trend driven by severity rather than volume.
Medical professional liability premiums have risen for seven consecutive years, the longest sustained upward trend since the early 2000s, according to AMA analysis. In 2025, about 39.9 percent of reported premiums increased year over year. The driver is not more lawsuits but larger ones: claim severity has climbed as large jury awards, sometimes called nuclear verdicts, become more frequent, along with rising legal defense costs and social inflation.
The severity trend is concrete. Industry reinsurance data tracked a record number of verdicts exceeding 25 million dollars in recent years, and one carrier reported that its average paid indemnity on closed claims rose 37 percent over a recent five-year period compared with the prior five years. States that have relaxed or lack caps on non-economic damages are expected to see continued increases in claim severity, and premiums with them.
iSedate Analysis: Severity, not frequency, is the cost story
The premium trend looks paradoxical next to the claim data: claim frequency is broadly flat, most claims are dismissed, and defendants win most trials, yet premiums have risen seven years running. The reconciliation is that premiums price severity, not just frequency. A liability insurer's payout exposure is claim frequency multiplied by average severity, and while frequency held roughly steady, average severity climbed, reportedly around 37 percent at one carrier over five years. When the rare paid claim costs dramatically more, premiums rise even as most physicians never pay anything, making every provider a stakeholder in reducing the severity of the claims that do occur.
Formula: Insurer payout exposure equals claim frequency times average severity; with frequency roughly flat and average severity up about 37 percent over five years at one reporting carrier, rising premiums track severity growth rather than claim volume.
Calculation and interpretation original to iSedate.
Source: AMA premium analysis | Physicians Insurance liability update
Compare SedationVault plans and pricing
5 Documentation and Defense
Across every statistic in this report, one lever recurs: the medical record. Documentation is the physician's most direct influence over how a claim resolves.
Malpractice litigation is often perceived as rampant, but National Center for State Courts data show medical malpractice accounts for less than 5 percent of all pending personal-injury cases nationally. The more useful frame for a clinician is not the volume of litigation but what determines its outcome, and that comes down to whether the record demonstrates the standard of care was met.
Risk-management guidance across the liability industry converges on the same advice: patient safety, communication, and precise medical documentation are the most effective ways to defend against or avoid a claim. Because a defense turns on proving what was done and why, a complete, contemporaneous, tamper-evident record is a physician's strongest evidence, both in the 65 percent of claims that get dismissed and in the small share that reach settlement or trial.
This connects directly to sedation and anesthesia care, where the stakes and the documentation burden are both high. Sedation cases involve time-stamped vitals, drug administration records, monitoring data, and consent, exactly the elements a liability defense relies on. A sedation record that captures these completely and produces an audit-ready report does double duty: it supports coverage and compliance day to day, and it stands as the evidentiary backbone if a case is ever questioned. For procedural specialties carrying above-average claim frequency, that record is not paperwork; it is protection.
Source: National Center for State Courts data | Liability risk-management guidance
Summary Table: All the Numbers
| Statistic | Figure | Source | Year |
|---|---|---|---|
| Total medical malpractice payments | $5.02 billion | NPDB | 2024 |
| Approximate average payout per paid claim | ~$439,000 | NPDB | 2024 |
| Total malpractice payments, 2013-2023 | $34 billion+ | NPDB | 2023 |
| Average paid reports per year, 2013-2023 | ~8,400 | NPDB | 2023 |
| Claims reported to NPDB (2023) | ~11,440 | NPDB | 2023 |
| Physicians ever sued (career) | ~29% | AMA | 2026 |
| Physicians over 55 ever sued | 45% | AMA | 2026 |
| General surgeon career claim rate | 53% | AMA | 2026 |
| OB/GYN career claim rate | 60% | AMA | 2026 |
| Claims dropped, dismissed, or withdrawn | ~65% | AMA | 2018 |
| Claims decided by trial verdict | ~6% | AMA | 2018 |
| Trial verdicts won by defendant | ~89% | AMA | 2018 |
| Claims resulting in no payment | ~72-80% | AMA/NEJM | 2024 |
| Consecutive years of rising premiums | 7 | AMA | 2026 |
| Premiums that increased in 2025 | 39.9% | AMA | 2025 |
| Malpractice share of personal-injury cases | <5% | NCSC | 2024 |
Frequently Asked Questions
How often do physicians get sued for malpractice?
How much is paid out in medical malpractice claims each year?
Do most malpractice claims result in a payout?
Why are medical liability premiums rising?
How does documentation affect malpractice defense?
Methodology and Sources
Claim-frequency figures (share of physicians sued, by age and specialty) and claim-outcome figures (dropped/dismissed, trial verdict, defendant win rate) are from the American Medical Association's Medical Liability Claim Frequency research, which is based on the AMA's nationally representative Physician Benchmark Surveys and includes both paid and unpaid claims. Payout totals, average payouts, and claim counts are from the National Practitioner Data Bank (NPDB), the federal repository of paid malpractice reports, as compiled in cited analyses. Premium-trend figures are from AMA premium analysis. The malpractice share of personal-injury litigation is from the National Center for State Courts (NCSC). Severity and nuclear-verdict trends are from medical professional liability insurer and reinsurer reporting.
Two limitations are important. First, the NPDB records only claims with an indemnity payment and therefore understates total claim activity, since most claims involve no payment; frequency and payout figures come from different datasets and should not be combined naively. Second, some widely circulated figures on this topic, such as claims that medical error is a leading cause of death, derive from contested studies and are not used here; this report relies on AMA, NPDB, and NCSC data. Average payout figures are skewed by a small number of very large awards and differ from median payouts.
Media and press: Journalists and researchers are welcome to cite these statistics with attribution to iSedate and a link to this page. Each figure includes its original Tier 1 source for independent verification.