






Uninsured and Dental Coverage Gap Statistics (2026): Who Lacks Coverage
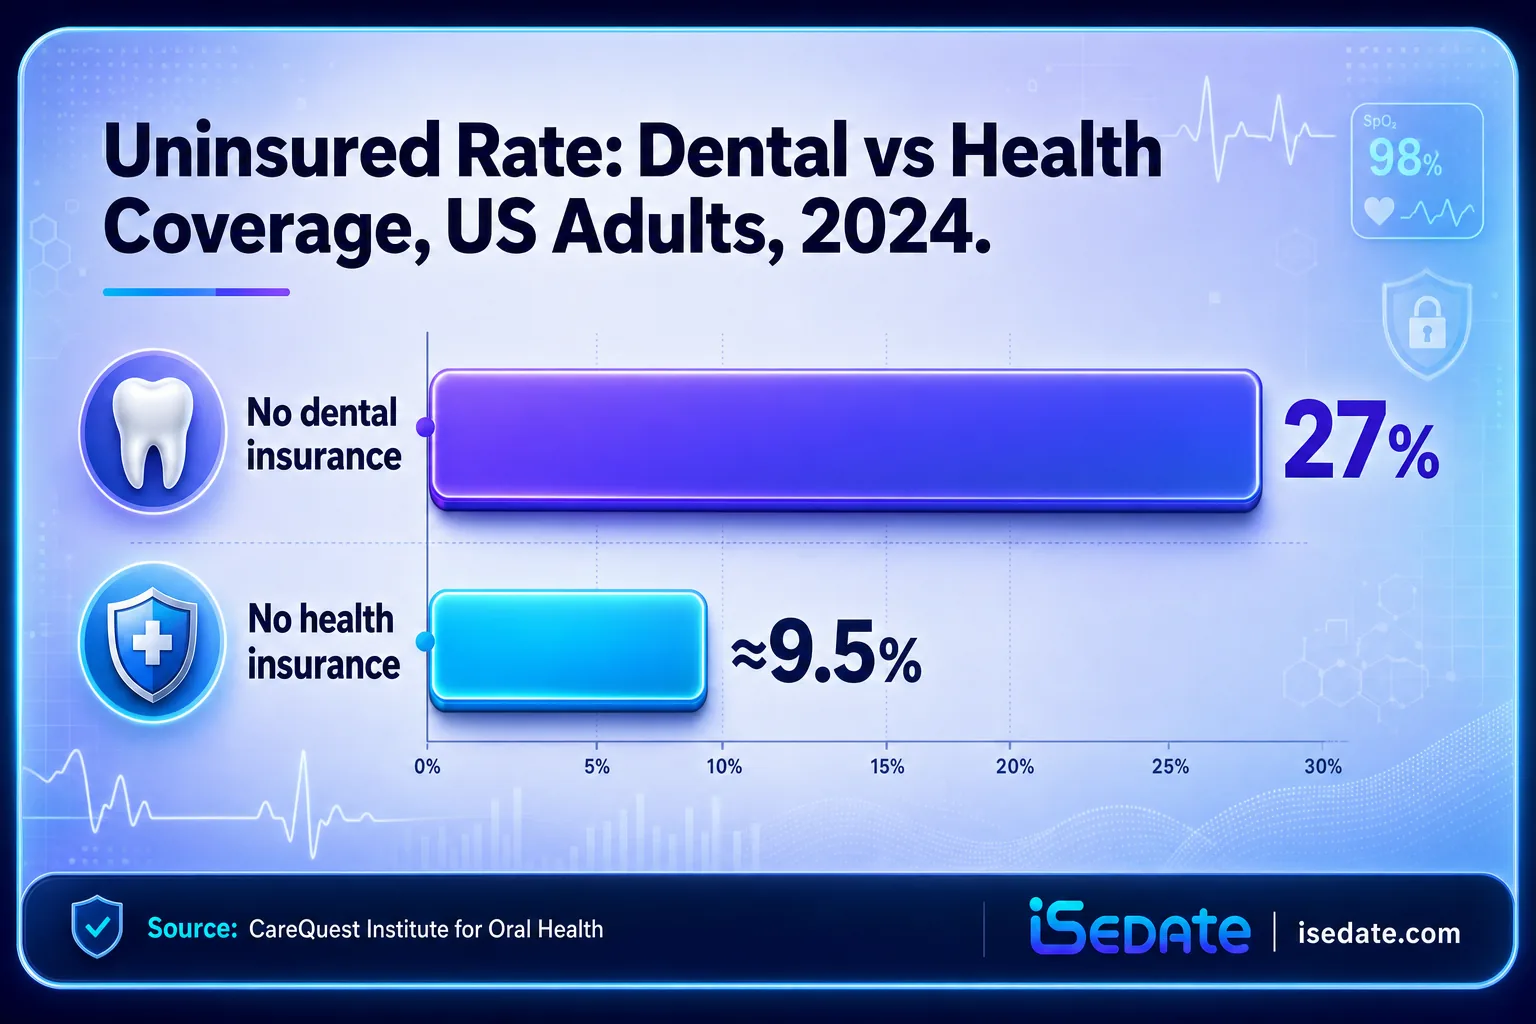
About 72 million U.S. adults, roughly 27 percent, have no dental insurance, nearly three times the share who lack health insurance, according to CareQuest Institute's 2024 survey. The dental coverage gap is one of the widest in American health care, and it falls hardest on seniors, low-income adults, and communities of color.
Key Takeaways
- 72 million adults (27%) lack dental insurance, nearly 3 times the health-uninsured rate of about 9 to 10 percent (CareQuest).
- Income drives the gap: 40 percent of adults without a high school diploma and 38 percent earning under 30,000 dollars lack dental coverage (CareQuest).
- Age matters: the youngest (18 to 29) and oldest (60+) adults are most likely to be uninsured (CareQuest).
- 31 million seniors: about 31 million adults aged 55 and older lack dental coverage (NADP Foundation).
- Public program gaps: roughly one-third of Medicare (31%) and Medicaid (33%) enrollees lack dental coverage (CareQuest).
- Coverage churn: 12 percent of uninsured adults lost coverage in the past year (CareQuest).
- Coverage drives visits: insured adults are twice as likely as the uninsured to see a dentist every six months, 60 percent versus 31 percent (NADP).
What's in This Guide
1 The Size of the Dental Coverage Gap
The headline number is stark, and it becomes more striking when set against medical coverage. Dental insurance lags far behind health insurance in the United States.
CareQuest Institute's State of Oral Health Equity in America (SOHEA) survey, the largest nationally representative survey focused exclusively on adult oral health with more than 9,000 respondents in 2024, found that about 72 million adults, roughly 27 percent, lack dental insurance. That is nearly three times the share of adults who lack health insurance, which sits near 9 to 10 percent.
The gap is not shrinking on its own. CareQuest found that 12 percent of currently uninsured adults lost their dental coverage in the past year, a churn that disproportionately affected younger adults and Asian/Pacific Islander, Black, and Hispanic adults. On the other side, nearly one in four adults with dental insurance gained it in the past year, either by switching plans or enrolling after being uninsured, showing how much movement runs through the system in both directions.
The root cause is structural. Dental coverage remains siloed from medical coverage, so the policy expansions that lifted medical insurance rates have largely bypassed dental. Traditional Medicare excludes routine dental care, adult Medicaid dental benefits are optional and inconsistent across states, and marketplace dental plans often lack the subsidies that make medical marketplace coverage affordable.
Source: CareQuest Institute for Oral Health
How office managers track coverage and payer mix
2 Who Lacks Coverage: Age, Income, and Race
The coverage gap is not evenly distributed. It concentrates sharply by income, education, age, and race, revealing who the current system leaves behind.
Income and education are the strongest predictors. Among adults without a high school diploma, 40 percent lack dental insurance, as do 38 percent of those earning under 30,000 dollars a year. That is more than double the uninsured rate among higher-income, college-educated adults.
Race and ethnicity show clear disparities too. Hispanic adults reported the highest dental uninsured rate at 30 percent, while Asian/Pacific Islander adults reported the lowest at 19 percent. Age follows a U-shaped pattern: the youngest adults (18 to 29) and the oldest (60 and older) are more likely to lack coverage than middle-aged adults, who tend to hold employer-sponsored plans during their peak working years.
Dental Uninsured Rate by Group (CareQuest)
Myth: The uninsured simply choose to skip dental coverage
The data point to affordability and access, not preference. The groups with the highest uninsured rates, low-income adults, those with less education, and older adults after retirement, are precisely those with the fewest affordable options. Early-career workers often hold part-time or gig jobs without benefits, and retirees lose employer plans when they age into Medicare, which excludes routine dental. Coverage gaps track the availability of affordable plans, not a lack of interest in oral health.
Source: CareQuest Institute for Oral Health
Explore SedationVault, the Sedation Intelligence System
3 The Senior Coverage Gap
Older Americans face a distinct cliff. Coverage that came with employment often disappears at retirement, and the program most seniors rely on offers no routine dental benefit.
An NADP Foundation-funded white paper by Charm Economics estimated that about 31 million individuals aged 55 and older lack dental insurance. Among that older-adult population, roughly 39 percent have coverage through public programs, 31 percent have private coverage, and the remaining 31 percent are uninsured.
ADA Health Policy Institute data underscore the cliff at 65. For seniors 65 and older, 33 percent have private dental benefits, 12 percent have public benefits, and 55 percent have no dental benefits, before accounting for Medicare Advantage plans. Because traditional Medicare provides no routine dental coverage, seniors who do not enroll in a Medicare Advantage plan with dental benefits, or buy a stand-alone policy, are left to pay out of pocket precisely when age-related conditions raise their dental needs.
Medicare Advantage has partly filled the gap. CareQuest found that the share of Medicare enrollees with dental coverage through a Medicare Advantage plan rose from 24 percent in 2021 to 36 percent in 2024. But those benefits vary widely and are often capped, so enrollment in a plan with a dental rider does not guarantee meaningful coverage for major work.
Source: NADP Foundation and Charm Economics | ADA Health Policy Institute
How oral surgeons document complex senior cases
4 Public Program Gaps: Medicare and Medicaid
Even among those enrolled in public health programs, dental coverage is far from guaranteed. Roughly a third of Medicare and Medicaid enrollees have no dental insurance at all.
About 31 percent of Medicare recipients and 33 percent of Medicaid recipients lack dental insurance. For Medicaid, the gap reflects that adult dental benefits are optional and vary by state, ranging from extensive coverage to emergency-only to none. CareQuest found the share of Medicaid adults with dental coverage through Medicaid actually fell from 64 percent in 2021 to 58 percent in 2024, likely tied to post-pandemic coverage unwinding.
The overlap between medical and dental uninsurance is severe. Among adults with no health insurance, 83 percent also lack dental coverage, creating a doubly vulnerable group that rarely receives preventive care of any kind.
iSedate Analysis: The compounding coverage gap
Combining CareQuest's figures shows how gaps stack. The overall adult dental uninsured rate is 27 percent, but it rises to 31 to 33 percent among Medicare and Medicaid enrollees and jumps to 83 percent among the health-uninsured. In other words, the groups least able to absorb out-of-pocket dental costs, public-program enrollees and the medically uninsured, carry uninsured rates well above the national average, compounding financial and health disadvantage.
Formula: National dental uninsured rate (27%, CareQuest) compared against subgroup rates, Medicare 31%, Medicaid 33%, and health-uninsured 83%, shows the gap widening 4 to 56 percentage points among already-vulnerable populations.
Calculation and interpretation original to iSedate.
Source: CareQuest Institute for Oral Health
See how accurate records support every coverage type
5 What the Gap Costs
A coverage gap is not just an insurance statistic. It translates directly into whether people see a dentist, and into higher costs downstream when preventable problems progress.
Coverage is one of the strongest predictors of whether someone visits the dentist. NADP reports that insured individuals are about twice as likely as the uninsured to visit a dentist every six months, 60 percent versus 31 percent, a pattern that has held for decades. Survey data show uninsured adults visit at less than one-third the rate of privately insured adults.
The downstream consequences are well documented. Without coverage, routine cleanings, exams, and early interventions are frequently postponed due to cost. Over time, minor issues progress into advanced periodontal disease, severe infections, and tooth loss, which are more difficult and expensive to treat. CareQuest cites research suggesting improved dental access could save the U.S. health system up to 100 million dollars a year by supporting earlier detection of chronic conditions in the dental setting.
The gap drives emergency-only care patterns
When patients lack coverage, they often skip preventive care and present only when pain forces a visit, frequently in emergency settings that cost more and deliver worse outcomes. For sedation and oral surgery practices, this shows up as higher-acuity cases arriving later, with more complex treatment needs. Uninsured patients who reach the point of needing extractions or surgical intervention represent both a clinical challenge and a documentation burden, since payment and consent processes differ sharply from insured care.
Source: National Association of Dental Plans | CareQuest Institute for Oral Health
Summary Table: All the Numbers
| Statistic | Figure | Source | Year |
|---|---|---|---|
| Adults without dental insurance | 72 million | CareQuest | 2024 |
| Adult dental uninsured rate | 27% | CareQuest | 2024 |
| Adult health uninsured rate (for comparison) | ~9.5% | CareQuest | 2024 |
| Uninsured adults who lost coverage in past year | 12% | CareQuest | 2024 |
| Adults with no HS diploma who are uninsured | 40% | CareQuest | 2024 |
| Adults under $30k income who are uninsured | 38% | CareQuest | 2024 |
| Hispanic adults uninsured for dental | 30% | CareQuest | 2024 |
| Asian/Pacific Islander adults uninsured | 19% | CareQuest | 2024 |
| Adults aged 55+ without dental insurance | 31 million | NADP Foundation | 2025 |
| Older adults uninsured (share) | 31% | NADP Foundation | 2025 |
| Older adults with public dental coverage | 39% | NADP Foundation | 2025 |
| Seniors 65+ with no dental benefits | 55% | ADA HPI | 2024 |
| Medicare enrollees without dental coverage | 31% | CareQuest | 2024 |
| Medicaid enrollees without dental coverage | 33% | CareQuest | 2024 |
| Health-uninsured adults also lacking dental | 83% | CareQuest | 2024 |
| Medicare Advantage dental coverage share | 36% | CareQuest | 2024 |
| Medicare Advantage dental share (2021) | 24% | CareQuest | 2021 |
| Insured vs uninsured six-month visit rate | 60% vs 31% | NADP | 2024 |
| Potential annual system savings | $100 million | CareQuest | 2024 |
Frequently Asked Questions
How many Americans lack dental insurance?
Why is the dental uninsured rate higher than the health uninsured rate?
Which groups are most likely to lack dental coverage?
How many seniors lack dental coverage?
How does lacking dental insurance affect care?
Methodology and Sources
Coverage-gap and demographic figures are primarily from CareQuest Institute for Oral Health's State of Oral Health Equity in America (SOHEA) survey, a nationally representative survey of more than 9,000 adults conducted by NORC at the University of Chicago in 2024, reported in the Out of Pocket brief. Senior coverage figures are from an NADP Foundation-funded white paper by Charm Economics analyzing publicly available data on adults aged 55 and older. Coverage-by-age-and-source figures for seniors are from the ADA Health Policy Institute. Visit-rate comparisons between insured and uninsured adults are from NADP's State of the Dental Benefits Market report.
Figures are drawn from survey and analysis data; the health uninsured comparison rate of about 9 to 10 percent is reported alongside the dental figure in CareQuest's own materials. Where different sources use slightly different age cutoffs (55 and older for the NADP Foundation paper, 65 and older for ADA HPI), those distinctions are stated so the figures are not conflated. Survey estimates carry sampling limitations noted by the publishing organizations.
Media and press: Journalists and researchers are welcome to cite these statistics with attribution to iSedate and a link to this page. Each figure includes its original Tier 1 source for independent verification.