






Dental Office Emergency Statistics (2026): Frequency, Types & Preparedness
Medical emergencies are uncommon in the dental office but far from rare: surveys place one every 2 to 4 years in a typical practice, and 50% to 70% of dentists witness at least one each year. Fainting dominates the data, most events resolve in the chair, and the biggest weakness is preparedness rather than frequency.
Key Takeaways
- Roughly one every 2 to 4 years. Practitioner surveys report 0.5 to 2 events per dentist per year, and 50% to 70% witness at least one annually.
- Syncope leads. Vasovagal syncope accounts for about 32% to over 50% of in-office emergencies; hypoglycemia is second.
- Most resolve in-office. One 14-year study found only 13% of events required ER transfer; another found 90.5% recovered and went home the same day.
- Timing spreads across the visit. In a national survey, 71.6% of emergencies occurred during the procedure; another study found events split evenly before, during, and after.
- Preparedness lags. Nearly 97% of practices have a plan, but only about half of dentists feel prepared and just 11% recorded vital signs at every visit in one survey.
- Volume is real. A survey of 4,309 North American dentists tallied more than 30,000 emergencies over their careers.
What's in This Guide
1 How Often Dental Emergencies Occur
Estimating frequency is difficult because most data comes from practitioner recall rather than a central registry, but the ranges converge. International surveys indicate a medical emergency is likely to occur in a dental office every 2 to 4 years, while retrospective practitioner surveys report a prevalence between 0.5 and 2 events per dentist per year. Between 50% and 70% of dental practitioners witness at least one medical emergency each year, and more than a quarter encounter multiple.
Records-based studies, which use actual patient-visit denominators rather than memory, report lower and more precise figures. A 14-year study at a teaching dental hospital found an incidence of 17.4 emergency events per 100,000 patients. A separate 8.5-year analysis found 164 medical emergencies per 1 million patient visits. The scale of exposure over a career is still substantial: a survey of 4,309 dentists across North America reported a combined total of more than 30,000 emergencies over their years in practice.
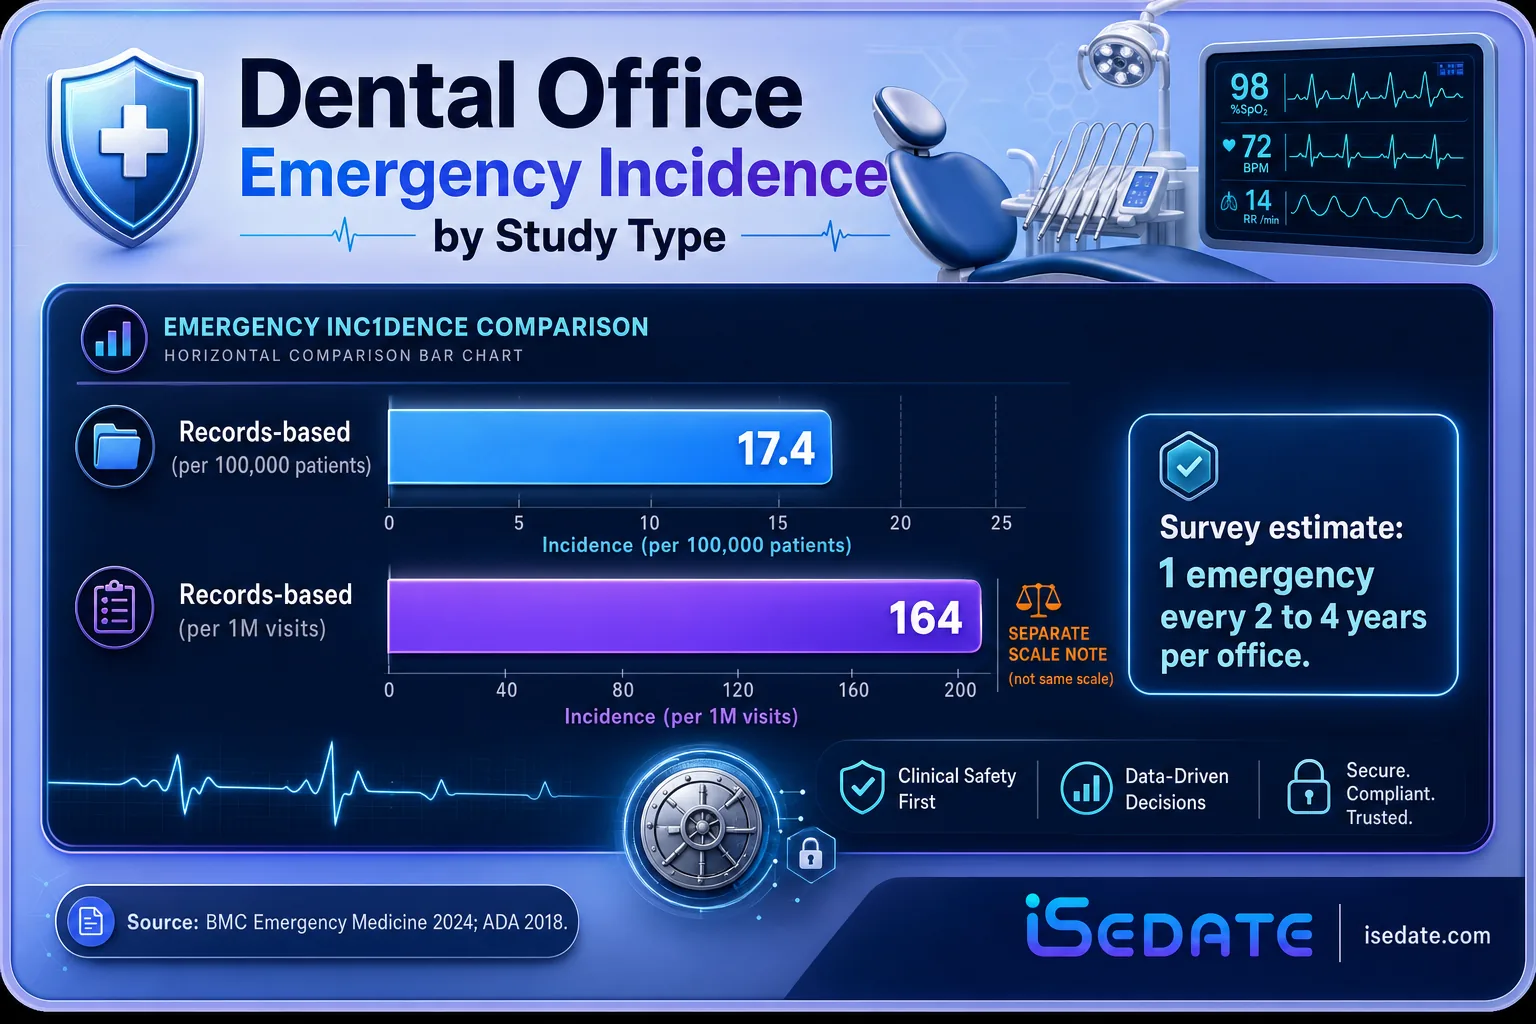
The gap between survey estimates and records-based rates matters. Survey recall tends to overstate frequency because memorable events are easier to recall, while records-based studies capture only documented incidents and may undercount minor events managed informally. Read together, they bracket the true rate: uncommon per patient, but near-certain across a career.
Source: Frequency and Features of Medical Emergencies at a Teaching Dental Hospital (PMC) | ADA: Medical Emergencies in the Dental Office
See how documentation supports emergency readiness2 The Most Common Emergency Types
The distribution of emergency types is remarkably stable across countries and decades. Vasovagal syncope, or fainting, is the single most common event by a wide margin. Across published surveys it accounts for roughly 32% to more than 50% of all in-office emergencies, and in one records-based study more than 60% of incidents were vasovagal syncope. Hypoglycemia is consistently the second most common.
Below syncope and hypoglycemia, the common tier includes mild-to-moderate allergic reactions, hyperventilation, anginal pain, acute asthma, and seizures. Acutely life-threatening events such as myocardial infarction, anaphylaxis, and cardiac arrest are much less common but carry the highest stakes. One survey found that although life-threatening emergencies are rare, about 1 in 20 general dental practitioners will have to perform CPR at least once during their career.
Most Common Dental Office Medical Emergencies (typical survey ranking)
Myth: Sedation is the main source of dental emergencies
Most dental office emergencies are not caused by sedation at all. Syncope, hypoglycemia, and allergic reactions dominate the data and can occur in any dental visit, including in healthy ASA 1 patients receiving no sedation. Sedation raises the stakes and adds respiratory risk, but the everyday emergency profile of a dental office is driven by patient physiology and anxiety, which is why preparedness matters for every practice, not just those offering sedation.
Source: Syncope in Dental Practices: A Systematic Review (ScienceDirect) | Prevalence of Medical Emergencies in Dental Practice (Resuscitation)
Flag risk factors at intake3 Outcomes and ER Transfer Rates
The reassuring counterpoint to frequency is that most dental office emergencies resolve without hospitalization. In the 14-year teaching-hospital study, only 13% of emergency events required transfer to the emergency room. In an 8-year single-center study, 90.5% of patients with a medical emergency recovered during the day and returned home, while 9.5% were hospitalized. Syncope, the most common event, typically resolves within about 2 minutes of onset with proper positioning.
Fatal outcomes are rare. In a nationwide web-based survey of Italian dentists, emergencies resulting in death were declared by only 0.9% of respondents. Survival after in-office cardiac events can be high when response is prompt: one survey reported an 83% survival rate among dental office CPR cases. The variable that separates a routine recovery from a poor outcome is usually the speed and quality of recognition and response, not the raw frequency of events.
| Outcome | Figure | Study |
|---|---|---|
| Required ER transfer | 13% | 14-year teaching hospital |
| Recovered same-day, went home | 90.5% | 8-year single-center |
| Hospitalized | 9.5% | 8-year single-center |
| Emergency resulting in death | 0.9% | Italian national survey |
| Survival after in-office CPR | 83% | French practice survey |
Source: Incidence and Characteristics of Medical Emergencies Related to Dental Treatment (PMC) | Medical Emergencies in Dental Practice: Nationwide Survey of Italian Dentists (PubMed)
Explore anesthesia record software4 Timing and Patient Risk Factors
Dental emergencies do not concentrate in a single moment of the visit. In the nationwide Italian survey, 71.6% of medical emergencies occurred during the dental procedure. Yet a records-based study found events distributed roughly equally before, during, and after treatment, a reminder that monitoring and vigilance cannot stop when the drill does. The recovery and post-procedure window carries real risk.
Patient factors shape both likelihood and severity. In the 14-year study, higher ASA class (2 and 3) and general dental procedures were associated with transfer to the emergency room, and a positive medical history predicted the type of emergency. One-third of emergency patients in that study were ASA 2 or 3. At the same time, medical emergencies occur in healthy individuals too: syncope was most common in healthy ASA 1 patients, driven by anxiety rather than underlying disease.
iSedate Analysis: The post-procedure blind spot
Two datasets together highlight a monitoring gap. When one records-based study found emergencies split roughly evenly across the before, during, and after phases, while a national survey found 71.6% clustered during the procedure, the difference points to how attention is allocated. Practices watch most closely during active treatment, so during-procedure events are both more frequent and more likely to be caught. The before and after phases, where monitoring often relaxes, represent the blind spot.
Interpretation: if roughly one-third of events fall outside the active-treatment window (per the evenly-distributed records data), continuous vitals capture that extends into recovery, rather than spot checks, is where unrecognized events are most likely to be caught early. Sources: Okayama 8-year records study; Italian national survey. Calculation and interpretation original to iSedate.
Source: Medical Emergencies in Dental Practice: Nationwide Survey of Italian Dentists (PubMed) | Frequency and Features of Medical Emergencies at a Teaching Dental Hospital (PMC)
See continuous vitals monitoring in SedationVault5 Office Preparedness and the Skills Gap
The clearest actionable finding is that preparedness, not frequency, is the weak link. A 2018 preparedness survey found nearly 97% of dental practices had a plan for responding to medical emergencies. But having a plan on paper is not the same as being ready. Only about 51% of dentists in one study felt prepared to handle medical emergencies, only 43.4% knew the correct CPR compression ratio of 30:2, and 76% were unfamiliar with medical emergency charts.
The monitoring and documentation gap is particularly telling. In one survey, 92% of offices obtained a thorough medical history before treatment, but only 11% recorded vital signs at each visit. Preparedness scoring across surveyed offices averaged only 55 out of 100, with emergency-drug availability at 35 and equipment at 19. The paper plan is common; the vital-sign baseline that would catch a developing emergency early is not.
Why a baseline and a timestamped record change outcomes
An emergency is easier to recognize when you know what normal looked like ten minutes earlier. Offices that capture vital signs and document them continuously have a baseline to compare against and a timestamped record to hand off to EMS or the emergency room. When most offices record vitals only sometimes, a developing event like early respiratory depression or an arrhythmia can pass unnoticed until it is acute. Consistent capture is the difference between reacting to a crisis and catching a trend.
iSedate's SedationVault addresses this directly for offices that sedate. SedationVault pulls live vitals from compatible monitors including Edan, MindRay, Criticare, and more into a continuous, timestamped record and produces one-click audit-ready PDF reports, so the baseline and the documentation the preparedness data keeps finding absent are captured as part of the workflow. For a practice, that record supports both real-time recognition and the clean handoff an emergency demands.
Source: Are Dental Professionals Ready to Deal With Medical Emergencies? (PMC) | State-Wide Survey of Medical Emergency Management in Dental Practices
Book a DemoDental Office Emergency Statistics: Summary Table
| Statistic | Figure | Source | Year |
|---|---|---|---|
| Estimated emergency frequency per office | Every 2 to 4 years | ADA / international surveys | 2018 |
| Events per dentist per year (survey) | 0.5 to 2 | Retrospective practitioner surveys | 2024 |
| Dentists witnessing an emergency yearly | 50% to 70% | BMC Emergency Medicine review | 2024 |
| Records-based incidence | 17.4 per 100,000 patients | 14-year teaching hospital study | 2024 |
| Records-based incidence (visits) | 164 per 1M patient visits | University at Buffalo, 8.5-year | 2018 |
| Career emergencies, 4,309 dentists | 30,000+ | North American dentist survey | 2018 |
| Syncope share of emergencies | 39% to 50.3% | Published survey range | 2018 |
| Records study: incidents that were syncope | Over 60% | Okayama 8-year study | 2021 |
| Average syncope cases per dentist/year | 1.2 | Meta-analysis | 2021 |
| Dentists performing CPR in career | 1 in 20 | Resuscitation survey (France) | 2010 |
| Events requiring ER transfer | 13% | 14-year teaching hospital study | 2024 |
| Recovered same-day, went home | 90.5% | Okayama 8-year study | 2021 |
| Emergency resulting in death | 0.9% of respondents | Italian national survey | 2023 |
| Emergencies during the procedure | 71.6% | Italian national survey | 2023 |
| Emergency-associated extractions | 45.2% | Okayama 8-year study | 2021 |
| Practices with a response plan | ~97% | 2018 CDP preparedness survey | 2018 |
| Dentists feeling prepared | 51% | Preparedness survey | 2025 |
| Correct CPR compression ratio known | 43.4% | Preparedness survey | 2025 |
| Offices recording vitals every visit | 11% | Preparedness study | 2022 |
Frequently Asked Questions
How often do medical emergencies happen in dental offices?
What is the most common medical emergency in a dental office?
How many dental office emergencies require a hospital transfer?
When during treatment are dental emergencies most likely?
How prepared are dental offices for medical emergencies?
Methodology & Sources
Figures in this article are drawn from peer-reviewed records-based studies, systematic reviews, and national practitioner surveys rather than secondary aggregators. Because dental office emergency frequency is often estimated from practitioner recall, survey-based rates and records-based incidence rates are reported separately and labeled by study type; the two bracket the true rate rather than agreeing precisely. Denominators vary between studies, so figures are presented with their source datasets rather than merged.
Primary sources: Frequency and Features of Medical Emergencies at a Teaching Dental Hospital in Saudi Arabia, 14-year study (BMC Emergency Medicine / PMC, 2024); Incidence and Characteristics of Medical Emergencies Related to Dental Treatment, Okayama University 8-year study (PMC, 2021); ADA Member Advantage, Medical Emergencies in the Dental Office (American Dental Association, 2018 survey data); Syncope in Dental Practices: A Systematic Review (ScienceDirect, 2021); Prevalence of Medical Emergencies in Dental Practice (Resuscitation, 2010); Medical Emergencies in Dental Practice: A Nationwide Web-Based Survey of Italian Dentists (PubMed, 2023); Are Dental Professionals Ready to Deal With Medical Emergencies? (PMC, 2022); state-wide survey of medical emergency management in dental practices (Saxony register survey); University at Buffalo School of Dental Medicine 8.5-year analysis via Dimensions of Dental Hygiene. Older data is included for historical and comparative context and labeled by year.
Media & Press Use
Journalists, researchers, and educators are welcome to cite these statistics with attribution to iSedate and a link to this page. For the iSedate Analysis figure, please credit the calculation as original to iSedate. For interviews or additional data on sedation monitoring and documentation, contact iSedate at [email protected].