






Oral Surgery Complication Statistics 2026: Nerve Injury, Infection, Anesthesia & Emergencies
Oral surgery is remarkably safe, but no surgery is complication-free. The published rates are reassuringly low: infection near 4%, permanent nerve injury under 1%, and anesthesia mortality below one in a million. The pattern that matters is that almost every serious complication is predictable, assessable, and, critically, documentable before it happens.
Key Takeaways
- Inferior alveolar nerve injury is cited at about 4 per 1,000 mandibular third molar extractions; permanent injury typically runs 0.35% to 0.6% (peer-reviewed literature).
- Infection after third molar surgery runs about 3.95%, and root displacement about 5.28% in systematic-review data.
- Post-operative pain is the single most reported issue, around 22% of cases.
- Nerve injury risk climbs dramatically with anatomy: compressed contact between the tooth and the nerve canal raised permanent injury risk to 18.2% in one cohort.
- Office anesthesia under the oral surgery team model is very safe: 0% mortality across a 17,634-sedation Mayo Clinic cohort, with published mortality between 1 in 348,602 and 1 in 1,733,055.
- A medical emergency occurs in a dental office roughly every 2 to 4 years per practitioner; syncope is the most common, at 39% to over 50% of events.
- Complication rates are clinical. Liability exposure is documentary: the record is what turns a known, consented risk into a defensible outcome.
What's in This Guide
The Overall Complication Picture
Third molar extraction accounts for between 35.9% and 58.7% of all oral surgical procedures, so most complication data is anchored there, but the categories generalize across the specialty. A systematic review of coronectomy and third molar procedures offers a clean composite of what can go wrong and how often.

In that review, infection occurred in 3.95% of procedures, dry socket in 1.12%, root extraction difficulty in 5.28%, reintervention in 1.13%, inferior alveolar nerve injury in 0.59%, and lingual nerve injury in 0.22%, with pain the most reported outcome at 22.04%. The headline is consistent across the literature: the common complications are minor and self-limiting, while the serious ones are rare, but the serious ones are where documentation earns its keep.
| Complication | Reported Rate | Severity |
|---|---|---|
| Post-operative pain | ~22.04% | Minor, expected |
| Root displacement | ~5.28% | Minor to moderate |
| Infection | ~3.95% | Moderate |
| Reintervention | ~1.13% | Moderate |
| Dry socket (in this cohort) | ~1.12% | Minor to moderate |
| Inferior alveolar nerve injury | ~0.59% | Serious |
| Lingual nerve injury | ~0.22% | Serious |
Source: Coronectomy and third molar complication systematic review (PMC)
See how SedationVault documents every caseNerve Injury Rates
Nerve injury is the complication that most defines oral surgery's medicolegal risk, because it can be permanent and life-altering. Third molar removal is the most common cause of trigeminal nerve injury, and the inferior alveolar nerve (IAN) is the usual target.
The inferior alveolar nerve injury rate is frequently cited at 4 per 1,000 mandibular third molar extractions, with lingual nerve injury at roughly 1 per 1,000. Permanent neurosensory injury is well under 1% in most series, commonly reported between 0.35% and 0.6%. Temporary injury is more variable, with cohorts reporting anywhere from under 3% to over 8% at one week depending on anatomy and technique.
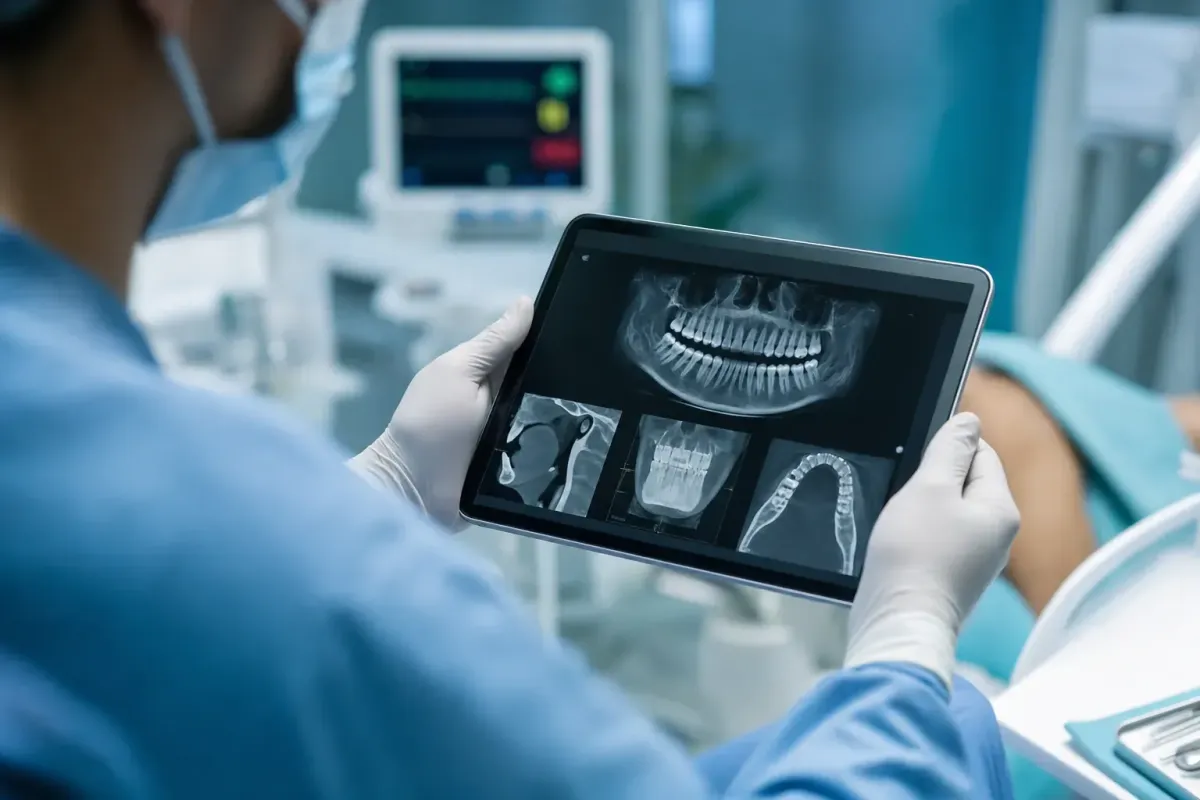
The anatomy, not the average, predicts the risk. A prospective cohort of 705 impacted lower third molar extractions found transient IAN injury in 2.4% and permanent injury in 0.57% overall, but the numbers changed drastically with proximity: when the tooth was in compressed contact with the nerve canal, permanent injury risk jumped to 18.2%, a relative risk of roughly 48 times. This is the entire argument for pre-operative imaging (panoramic and, in high-risk cases, CBCT) and for documenting that the nerve relationship was assessed and the risk disclosed. The population average of "under 1%" is meaningless for the individual patient whose tooth sits against the canal.
Permanent IAN Injury Risk by Nerve-Canal Relationship
Source: Journal of Oral and Maxillofacial Surgery (prospective IAN cohort, 2024) | Frontiers of Oral and Maxillofacial Medicine (trigeminal injury review)
Wisdom tooth cost and complication dataSurgical Complications: Infection, Bleeding, Displacement
Beyond nerves, the routine surgical complications are infection, bleeding, root or tooth displacement, and the local wound problems that follow any extraction. These are more common than nerve injury but usually resolve with straightforward management.
Infection near 4% is consistent with broader extraction data, and prophylactic antibiotics can reduce it, though systematic reviews caution that routine antibiotic use carries its own resistance and adverse-effect risks. Root displacement, where a fragment is pushed into an adjacent space, occurs in around 5% of complex cases and occasionally requires a second procedure to retrieve, which is itself a documented source of secondary nerve injury. The common thread is that each of these events has a management pathway, and the record of how it was recognized and handled is what protects the practice.
Source: Third molar complication systematic review (PMC) | Dry socket prevalence study (PMC)
Document recognition and managementAnesthesia-Related Complications
Because so much oral surgery happens under sedation or general anesthesia, anesthesia complications are the most scrutinized category, and the data strongly supports the office-based team model. A Mayo Clinic review of 17,634 sedations from 2004 to 2019 found 16 adverse events (0.1%) and no deaths. Massachusetts oral surgeons reporting on hundreds of thousands of visits similarly concluded the anesthesia-related death rate was likely under one in a million.
Published mortality estimates for office sedation and general anesthesia span 1 in 348,602 to 1 in 1,733,055 cases. Closed-claim analyses add important context: most patients in anesthesia morbidity and mortality claims were ASA class II or III with pre-existing conditions such as obesity, cardiac disease, or COPD. In other words, the rare bad outcomes cluster in identifiable higher-risk patients, exactly the patients a thorough, documented pre-sedation assessment is designed to flag.
iSedate Analysis: Expected anesthesia adverse events at scale
Formula: 0.1% adverse event rate (Mayo cohort) applied to ~5 million annual wisdom tooth patients, many sedated.
If the Mayo Clinic's 0.1% adverse event rate held across the roughly 5 million patients who have wisdom teeth removed each year, and even assuming only a portion are sedated, the implied volume of anesthesia adverse events nationally still runs into the thousands per year. Individually rare, collectively frequent enough that every practice should expect to manage them, and to have documented that it was prepared to. This is an order-of-magnitude illustration, not a claim about the national rate.
Sources: Mayo Clinic sedation adverse event rate; AAOMS annual patient volume. Calculation and interpretation original to iSedate.
Source: Journal of Oral and Maxillofacial Surgery (Mayo Clinic sedation review) | Massachusetts OMS morbidity and mortality survey
See continuous vitals chartingIn-Office Medical Emergencies
Separate from procedure-specific complications, any oral surgery visit can trigger a medical emergency, most often unrelated to the surgery itself. These are the events every office must be equipped and documented to manage.

A large survey of French and Belgian dentists found an incidence of 2.1 medical emergency events per dentist per year, mostly vasovagal syncope, orthostatic hypotension, or hypoglycemia, with cardiac arrest rare at 0.003 events per dentist per year. Syncope dominates every published survey, accounting for 39% to more than 50% of in-office emergencies, and a meta-analysis found dentists encounter an average of 1.2 syncope cases annually. The ADA notes a medical emergency is likely in a given dental office every two to four years, and roughly 20% of emergencies follow local anesthesia administration.
Preparedness is measured, and often found wanting. The same research that quantifies these emergencies also found that nearly one in five dentists had no emergency equipment, and only about 57% of practices kept an oxygen cylinder. Roughly 75% of dental professionals will witness or manage syncope in their careers, yet many rate themselves unprepared. The statistic that should worry a malpractice carrier is not the emergency rate, it is the readiness gap, and whether the practice can document the training, equipment, and response that closed it.
Source: Frequency of medical emergencies at a dental hospital (BMC Emergency Medicine) | American Dental Association: Medical Emergencies
Compare SedationVault plans and pricingWhy Documentation Changes the Outcome
Every statistic above splits into two questions. The clinical question, how often does this happen, is answered by the literature. The practice question, what happens to us when it does, is answered by the record. Those are different problems, and only one of them is under the practice's direct control.
When a nerve injury, infection, or anesthesia event is reviewed, whether by a malpractice carrier, a licensing board, or a plaintiff's expert, the questions are always the same. Was the patient properly assessed? Was the nerve relationship imaged and disclosed? Were vitals monitored and recorded continuously? Was consent documented? Was the emergency response appropriate and equipped? A practice with complete, timestamped records answers each with evidence. One relying on notes reconstructed after the fact does not.
Where iSedate's SedationVault fits. SedationVault is a complete sedation charting and compliance platform designed to close exactly this documentation gap. It captures the pre-sedation assessment and ASA classification, feeds live vitals from compatible monitors (Edan, MindRay, Criticare, and more) into a timestamped sedation record, stores digital intake and consent, and generates one-click, audit-ready PDF reports. Its Sedation Intelligence System layers on drug inventory, logs, license and certification tracking, emergency equipment oversight, and board-ready reporting, turning the readiness gap the data exposes into something a practice can prove it has closed.
Source: Closed-claim analysis of office anesthetic cases (PubMed)
Book a SedationVault demoOral Surgery Complication Statistics: Summary Table
| Statistic | Figure | Source | Year |
|---|---|---|---|
| Third molar share of all oral surgery | 35.9%–58.7% | Systematic review (PMC) | 2021 |
| Post-operative pain (most reported) | ~22.04% | Systematic review (PMC) | 2021 |
| Root displacement | ~5.28% | Systematic review (PMC) | 2021 |
| Infection after third molar surgery | ~3.95% | Systematic review (PMC) | 2021 |
| Reintervention | ~1.13% | Systematic review (PMC) | 2021 |
| IAN injury (frequently cited) | 4 per 1,000 | Frontiers Oral Maxillofac. Med. | 2021 |
| Lingual nerve injury | ~1 per 1,000 | Frontiers Oral Maxillofac. Med. | 2021 |
| Permanent IAN injury (typical) | 0.35%–0.6% | Peer-reviewed literature | 2024 |
| Transient IAN injury (705-patient cohort) | 2.4% | J. Oral Maxillofac. Surg. | 2024 |
| Permanent IAN injury, compressed canal contact | 18.2% | J. Oral Maxillofac. Surg. | 2024 |
| Anesthesia adverse event rate (Mayo) | 0.1% of 17,634 | J. Oral Maxillofac. Surg. | 2020 |
| Anesthesia mortality (Mayo cohort) | 0% | J. Oral Maxillofac. Surg. | 2020 |
| Published office anesthesia mortality range | 1/348,602 to 1/1,733,055 | J. Oral Maxillofac. Surg. | 2008 |
| Medical emergencies per dentist/year | ~2.1 | Dental emergency survey | 2021 |
| Syncope share of in-office emergencies | 39%–50%+ | ADA / systematic review | 2023 |
| Cardiac arrests per dentist/year | 0.003 | Dental emergency survey | 2021 |
| Practices with no emergency equipment | ~1 in 5 | Dental emergency survey | 2021 |
Frequently Asked Questions
How common are complications in oral surgery?
What is the rate of nerve injury after wisdom tooth removal?
How often do medical emergencies happen in a dental or oral surgery office?
What is the most common complication of oral surgery?
How does documentation affect oral surgery complications?
Methodology & Sources
Complication rates are drawn from peer-reviewed primary sources: a systematic review of coronectomy and third molar procedures (PMC) for the composite complication profile; a 2024 prospective cohort in the Journal of Oral and Maxillofacial Surgery for inferior alveolar nerve injury rates and risk factors; a trigeminal nerve injury review in Frontiers of Oral and Maxillofacial Medicine for the per-1,000 injury rates; the Journal of Oral and Maxillofacial Surgery for the Mayo Clinic sedation cohort and the Massachusetts morbidity and mortality survey; a closed-claim analysis indexed in PubMed for anesthesia claim characteristics; and dental medical-emergency surveys plus American Dental Association guidance for in-office emergency frequency. Some foundational figures predate four years and are presented with historical context where no newer primary replacement exists. Rates are expressed as ranges where the literature varies by cohort, anatomy, and definition. Where a figure derives from combining two sources, it is labeled as an iSedate Analysis with its inputs shown.
Media and press usage: Journalists and researchers are welcome to cite the statistics in this article with attribution to the original primary sources named above, and to iSedate for any analysis labeled as original. A link back to this page is appreciated.
This article discusses surgical complications, anesthesia adverse events, and patient safety. It is an informational statistical overview for clinical and practice-management audiences and is not medical or legal advice. Complication rates are population estimates, not individual predictions.