






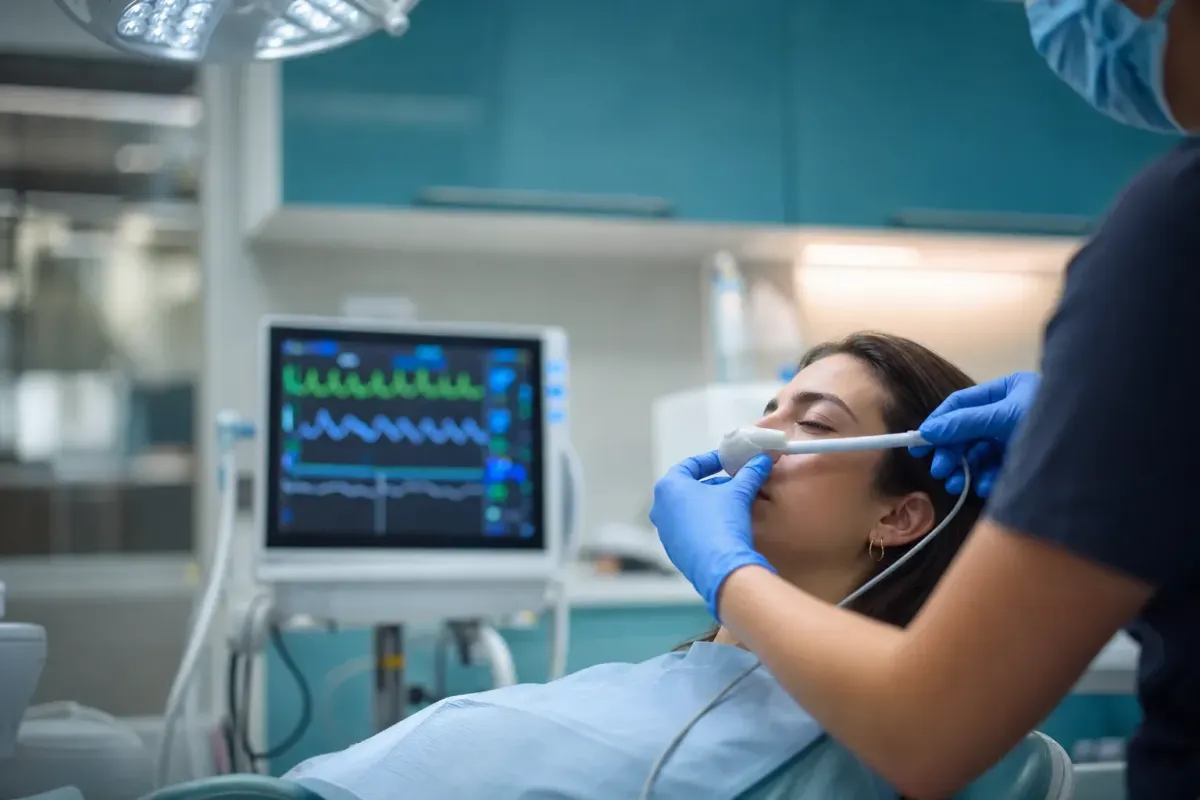
Sedation-Related Adverse Event Statistics (2026): What the Data Shows
Sedation-related adverse events remain rare on a per-procedure basis, but the data is consistent about where harm comes from: respiratory compromise, oversedation, and monitoring gaps drive the most severe outcomes. Pooled dental reviews put the death rate near 1 in 327,684 procedures, yet closed-claim files show that a large share of serious events were predictable and preventable.
Key Takeaways
- Deaths are rare but not zero. Reviews of dental procedures since 1955 found 218 deaths across about 71.4 million patients, roughly 1 in 327,684, with the per-million rate falling by half over the period.
- Respiratory events lead. A 2025 review of 3,429 pediatric deep-sedation cases found respiratory events caused 57% of complications versus 21% for cardiovascular instability.
- Monitoring gaps recur. In one pediatric dental closed-claim series, only 1 of 13 sedation claims involved physiologic monitoring.
- A large share is preventable. A 415-case Spanish dental review found up to 44.3% of adverse events stemmed from predictable, preventable errors.
- Office AE rates can be low with structure. A 14-year oral-surgery IV sedation series of 6,209 sedations reported complications in 1.96% of patients and no deaths.
- Very young children are highest risk. Most pediatric closed-claim deaths occurred between ages 2 and 5, and local anesthetic overdose appeared in 41% of one claim set.
What's in This Guide
1 Sedation and Anesthesia Mortality Rates
Death associated with dental sedation and anesthesia is uncommon, and the long-run trend points down. A systematic review of more than 20 studies with usable data since 1955 identified 218 deaths across roughly 71.4 million patients, a mortality rate of about 1 in 327,684, with the per-million rate dropping from 6.2 to 3.0 between the earliest and most recent reports.
Estimates vary by setting and level of sedation. For deep sedation and general anesthesia specifically, accumulated reports place the death rate between roughly 1 in 348,602 and 1 in 1,733,055 cases. A separate systematic review of dental-treatment deaths found an average of 2.6 deaths reported per year across the studies analyzed, with anesthesia, sedation, and medication complications the single leading cause.

Two caveats matter when reading these figures. First, there is no unified national adverse-event registry for office-based dental sedation, so most rates come from insurance closed claims, coroner reviews, or single-region studies rather than a complete denominator. Second, reporting requirements differ by state, so unreported crisis events handled without injury are not captured. The rates below the surface are almost certainly higher than the fatal ones these reviews count.
Source: Death Rate of Dental Anaesthesia (PubMed) | Death Related to Dental Treatment: A Systematic Review
See how audit-ready compliance records work2 Leading Causes in Closed-Claim Data
When serious events do occur, closed-claim databases show a repeating pattern. In a systematic review of 148 dental-treatment fatalities, anesthesia, sedation, and medication complications were the leading cause at 70 deaths, ahead of cardiovascular events (31), infection (19), and airway or respiratory complications counted separately (18). The through-line is that agents and airway management, not the dental procedure itself, dominate the fatal cases.
The pediatric closed-claim literature is especially pointed. A review of malpractice claims from 1993 to 2007 found 17 claims for adverse anesthesia events, 13 of them involving sedation. Fifty-three percent of those claims involved patient death or permanent brain damage, the average patient age in that group was 3.6 years, and local anesthetic overdoses appeared in 41% of claims. The adverse event occurred in the dental office where care was provided in 71% of claims.
Myth: The dental procedure is the main danger
The data says otherwise. Across closed-claim reviews, the drugs and the airway drive the most severe outcomes, not the restoration or extraction. Oversedation, medication error, and polypharmacy of sedation drugs are repeatedly cited as contributors, which is why titration, dose documentation, and continuous monitoring matter more than the complexity of the dental work being done.
| Cause of Death | Count | Dataset |
|---|---|---|
| Anesthesia / sedation / medication | 70 | 148 dental-treatment fatalities |
| Cardiovascular events | 31 | 148 dental-treatment fatalities |
| Infection | 19 | 148 dental-treatment fatalities |
| Airway / respiratory complications | 18 | 148 dental-treatment fatalities |
| Bleeding | 5 | 148 dental-treatment fatalities |
| Other | 5 | 148 dental-treatment fatalities |
Source: Death Related to Dental Treatment: A Systematic Review | Adverse Events During Pediatric Dental Anesthesia and Sedation: Closed Malpractice Claims (PubMed)
Explore anesthesia record software3 Respiratory Events and Oversedation
If one signal is consistent across databases, it is that respiratory compromise is the predominant mechanism of serious sedation harm. A 2025 systematic review of 3,429 pediatric deep-sedation cases found respiratory events accounted for 57% of complications, compared with 21% for cardiovascular instability. Cohort studies of propofol sedation continue to report oxygen desaturation below 90% in 6 to 10% of cases.
The adult and mixed-population data agree. Analysis of the ASA Closed Claims database for monitored anesthesia care found that respiratory depression from an absolute or relative overdose of sedative agents, combined with inadequate oxygenation and ventilation, made up the majority of severe claims. In non-operating-room anesthesia settings, closed-claim reviews reported greater injury severity than in the operating room, with death and permanent brain damage occurring at higher rates and most claims stemming from adverse respiratory events.
Complication Type in a 3,429-Case Pediatric Deep-Sedation Review

The clinical implication is direct. Because respiratory decline is the primary path to catastrophe, the monitoring modalities that detect it early, pulse oximetry as the long-standing standard and capnography for ventilation, are the tools most tied to prevention. Oversedation is dangerous precisely because it depresses respiration before it produces obvious outward signs, so a monitor that flags falling saturation or end-tidal CO2 buys the response time that outward observation alone does not.
Source: BMC Oral Health: Intraoperative Adverse Events in Pediatric Deep Sedation | Respiratory Depression in Non-Operating Room Anesthesia (PMC)
See SedationVault vitals monitoring4 Patient Risk Factors and Age
Adverse-event risk is not evenly distributed. The clearest pattern is age: very young children carry the greatest risk, and most pediatric closed-claim deaths occurred between ages 2 and 5. Reviews of sedation-related deaths repeatedly identify patients under 5 as highest risk, and one pooled review noted that in children, most deaths clustered in the 2-to-5 age range.
Among adults, a closed-claim analysis of major office-anesthesia morbidity and mortality found that the majority of patients were ASA physical status II or III, with preexisting conditions such as gross obesity, cardiac disease, epilepsy, and chronic obstructive pulmonary disease that materially affect anesthesia care. In other words, the comorbidity profile of the patient is a stronger predictor of serious events than the anesthetic technique alone.
The wide incidence range in pediatric studies, from 8% to as high as 47.5% depending on drug and route, reflects how much definition and setting drive the numbers. Many of those events are minor and self-limited: in one systematic review, agitation reached 47.5%, postoperative pain up to 90%, and nausea 19.6%. Distinguishing common, minor events from rare, catastrophic ones is essential to reading sedation safety data accurately.
iSedate Analysis: Serious-event share within a broad AE range
Combining two Tier-1 datasets illustrates why "adverse event" needs a denominator and a severity filter. In a 175-case pediatric deep-sedation review, 19 adverse events occurred across 15 cases (about 9% of cases), and within those events, 47% were sedation-quality issues while 37% were airway or breathing problems. Applying that airway share to the case-level rate: 9% of cases with an AE, of which roughly 37% of events were respiratory, means the airway-specific event burden is a small fraction of the headline "up to 47.5%" figures that pool minor effects like agitation.
Formula: 15/175 cases with any AE (8.6%) × 37% of AEs classified airway/breathing = a respiratory-event concentration well below the broad AE ceilings, underscoring that most reported "adverse events" are minor.
Sources: BMC Oral Health / Journal of Pioneering Medical Sciences systematic review data. Calculation and interpretation original to iSedate.
Source: Major Morbidity or Mortality From Office Anesthetic Procedures (PubMed)
Capture health history and ASA status at intake5 Preventability and the Monitoring Gap
The most actionable finding in the literature is that a large share of serious sedation events was avoidable. An analysis of 415 dental adverse events in Spain found that up to 44.3% were due to predictable and preventable errors and complications. In the pediatric closed-claim series, the monitoring gap was stark: of the 13 claims involving sedation, only 1 involved the use of physiologic monitoring.
The contrast between poorly monitored claims and structured practice settings is instructive. A 14-year series of 6,209 IV sedations administered by an operating oral surgeon reported complications in 1.96% of patients, 122 patients experiencing 137 adverse events, with no deaths and no emergency hospital transports. Massachusetts oral and maxillofacial surgeons reporting on 431,680 anesthesia visits over two years described an adverse-event frequency near 0.1% with a 0% mortality rate. Structure, monitoring, and consistent records track with lower harm.
Why documentation is a safety tool, not just paperwork
When physiologic monitoring is absent or under-recorded, respiratory decline goes unrecognized until it becomes an emergency, and after the fact there is no timestamped record to reconstruct what happened. Continuous vitals capture and complete, timestamped sedation records address both problems at once: they support real-time recognition during the case and they produce the defensible documentation that closed-claim reviews so often find missing. This is the practical link between monitoring and preventability the data keeps pointing to.
iSedate's SedationVault was built around this exact gap. SedationVault pulls live vitals from compatible monitors including Edan, MindRay, Criticare, and more into a continuous sedation record, timestamps dose entries, and produces one-click audit-ready PDF reports, so the monitoring and documentation the literature ties to preventability are captured as a matter of workflow rather than memory. For practices carrying malpractice exposure, that record is the difference between a defensible chart and a reconstruction.
Source: Analysis of 415 Adverse Events in Dental Practice in Spain (PMC) | Outpatient Anesthesia Morbidity and Mortality Among Massachusetts OMSs
Book a DemoSedation-Related Adverse Event Statistics: Summary Table
| Statistic | Figure | Source | Year |
|---|---|---|---|
| Pooled dental procedure death rate since 1955 | 1 in 327,684 | Death Rate of Dental Anaesthesia review | 2017 |
| Dental deaths reviewed / total patients | 218 / ~71.4M | Death Rate of Dental Anaesthesia review | 2017 |
| Per-million death rate decline | 6.2 to 3.0 | Death Rate of Dental Anaesthesia review | 2017 |
| Deep sedation / GA death range | 1 in 348,602 to 1 in 1,733,055 | Bennett, Kramer, Bosack (JADA) | 2015 |
| Average dental-treatment deaths per year | 2.6 | Death Related to Dental Treatment review | 2016 |
| Leading cause of dental-treatment death | Anesthesia/sedation/medication (70 of 148) | Death Related to Dental Treatment review | 2016 |
| Pediatric claims with death or brain damage | 53% | Pediatric closed malpractice claims | 2012 |
| Pediatric sedation claims with local anesthetic overdose | 41% | Pediatric closed malpractice claims | 2012 |
| Adverse event occurred in dental office | 71% of claims | Pediatric closed malpractice claims | 2012 |
| Respiratory share of complications | 57% | Pediatric deep-sedation review (3,429 cases) | 2025 |
| Cardiovascular share of complications | 21% | Pediatric deep-sedation review (3,429 cases) | 2025 |
| Propofol oxygen desaturation below 90% | 6 to 10% | Propofol sedation cohort studies | 2025 |
| Major adverse events, 513-child cohort | 8.6% (no unplanned intubations) | Liu et al. cohort | 2025 |
| Pediatric AE incidence range by drug/route | 8% to 47.5% | Pediatric sedation/GA systematic review | 2025 |
| Preventable share of dental adverse events | Up to 44.3% | OESPO 415-event analysis (Spain) | 2010 |
| Pediatric sedation claims with physiologic monitoring | 1 of 13 | Pediatric closed malpractice claims | 2012 |
| Complication rate, 6,209-sedation OMS series | 1.96% (0 deaths) | Oral-surgery IV sedation series | 2017 |
| Massachusetts OMS anesthesia visits / AE frequency | 431,680 visits / ~0.1% AE, 0% mortality | Massachusetts OMS morbidity/mortality | 2019 |
Frequently Asked Questions
How common are deaths from dental sedation and anesthesia?
What is the leading cause of sedation-related adverse events?
How often are sedation adverse events preventable?
Which patients are at highest risk during sedation?
How does monitoring affect sedation safety outcomes?
Methodology & Sources
All figures in this article trace to primary, peer-reviewed, or professional-liability sources. Statistics were drawn from systematic reviews and closed-claim databases rather than secondary aggregators. Because there is no unified national registry for office-based dental sedation adverse events, rates are compiled from insurance closed claims, coroner and dental-board reviews, and single-region cohort studies, and denominators vary; figures are reported with their source datasets rather than merged into a single national rate.
Primary sources: Death Rate of Dental Anaesthesia systematic review (PubMed, 2017); Death Related to Dental Treatment: A Systematic Review (ScienceDirect, 2016); Bennett, Kramer & Bosack, "How Safe Is Deep Sedation or General Anesthesia While Providing Dental Care?" (Journal of the American Dental Association, 2015); Adverse Events During Pediatric Dental Anesthesia and Sedation: A Review of Closed Malpractice Insurance Claims (PubMed, 2012); retrospective evaluation of intraoperative adverse events in pediatric deep sedation (BMC Oral Health, 2025); Adverse Events Associated With Sedation and General Anesthesia in Pediatric Dentistry: A Systematic Review (Journal of Pioneering Medical Sciences, 2025); Respiratory Depression in Non-Operating Room Anesthesia (PMC, 2025); Major Morbidity or Mortality From Office Anesthetic Procedures (PubMed, 1991); Analysis of 415 Adverse Events in Dental Practice in Spain, OESPO (PMC, 2010-2014); Outpatient Anesthesia Morbidity and Mortality Among Massachusetts Oral and Maxillofacial Surgeons (Journal of Oral and Maxillofacial Surgery, 2019). Older foundational closed-claim data is included for historical trend context and labeled by year.
Media & Press Use
Journalists, researchers, and educators are welcome to cite these statistics with attribution to iSedate and a link to this page. For the iSedate Analysis figure, please credit the calculation as original to iSedate. For interviews or additional data on sedation documentation and monitoring, contact iSedate at [email protected].